Fig. 2

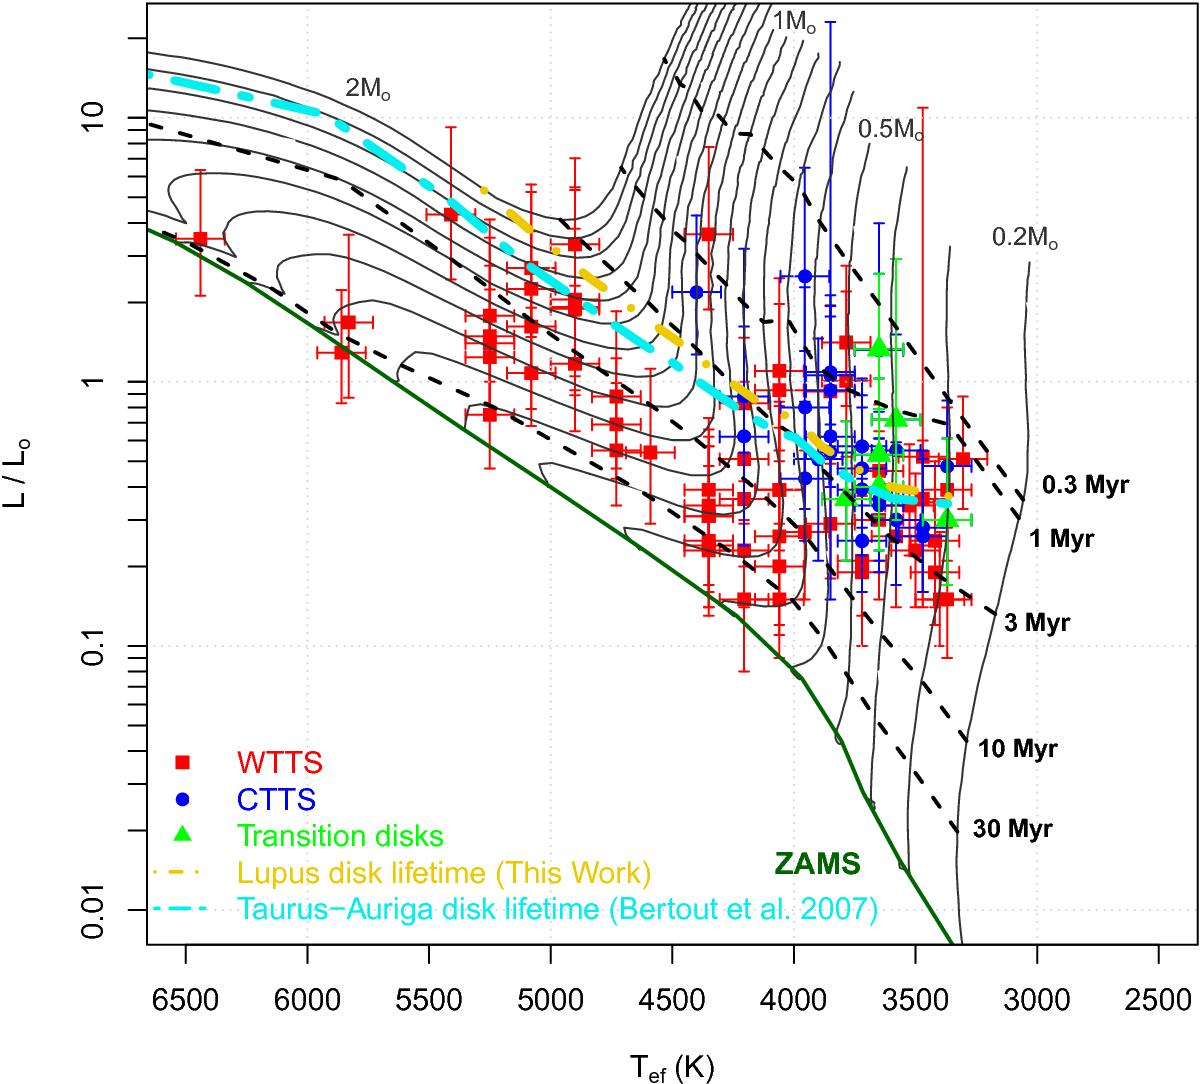
HRD of the Lupus association. Red squares and blue circles denote, respectively, the WTTSs and CTTSs in our sample. The green triangles represent those stars with transition disks (see Sect. 4). The error bars indicate the 1σ uncertainties on the stellar luminosities and effective temperatures. The black solid lines and dashed lines indicate, respectively, the evolutionary tracks and isochrones computed by Siess et al. (2000) with Y = 0.277 and Z = 0.02. The green solid line denotes the zero-age main sequence (ZAMS) computed with that model. The dash-dotted lines show the disk lifetime τd for the TTSs in the Lupus (this work) and Taurus-Auriga (Bertout et al. 2007) associations.
Current usage metrics show cumulative count of Article Views (full-text article views including HTML views, PDF and ePub downloads, according to the available data) and Abstracts Views on Vision4Press platform.
Data correspond to usage on the plateform after 2015. The current usage metrics is available 48-96 hours after online publication and is updated daily on week days.
Initial download of the metrics may take a while.


