Fig. 6
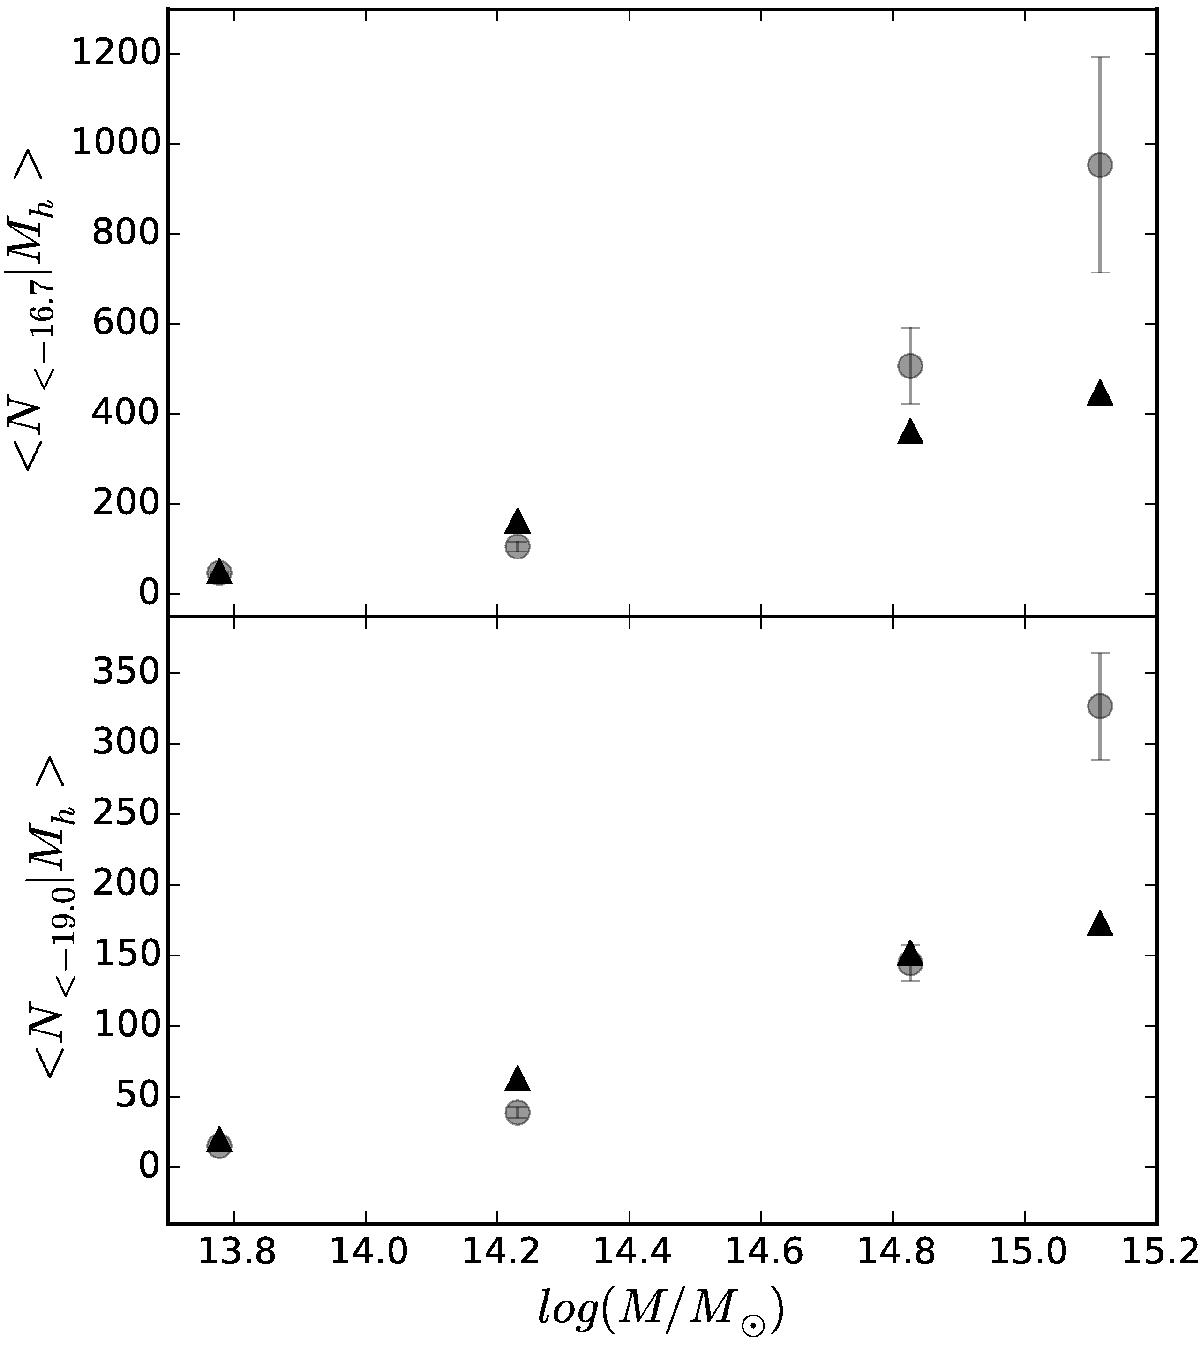
Comparison between galaxy abundances of four observed clusters taken from Weinmann et al. (2011) (triangles) and the corresponding results obtained with discount method (circles) in mass bins centred in these clusters. Here, we use masses of 6 × 10¹³ M⊙ for Fornax, 1.7 × 10¹⁴ M⊙ for Virgo, 6.7 × 10¹⁴ M⊙ for Perseus and 1.3 × 10¹⁵ M⊙ for Coma. Top panel show the abundances for Mlim = −16.7 and bottom panel for Mlim = −19.0.
Current usage metrics show cumulative count of Article Views (full-text article views including HTML views, PDF and ePub downloads, according to the available data) and Abstracts Views on Vision4Press platform.
Data correspond to usage on the plateform after 2015. The current usage metrics is available 48-96 hours after online publication and is updated daily on week days.
Initial download of the metrics may take a while.