Fig. 5
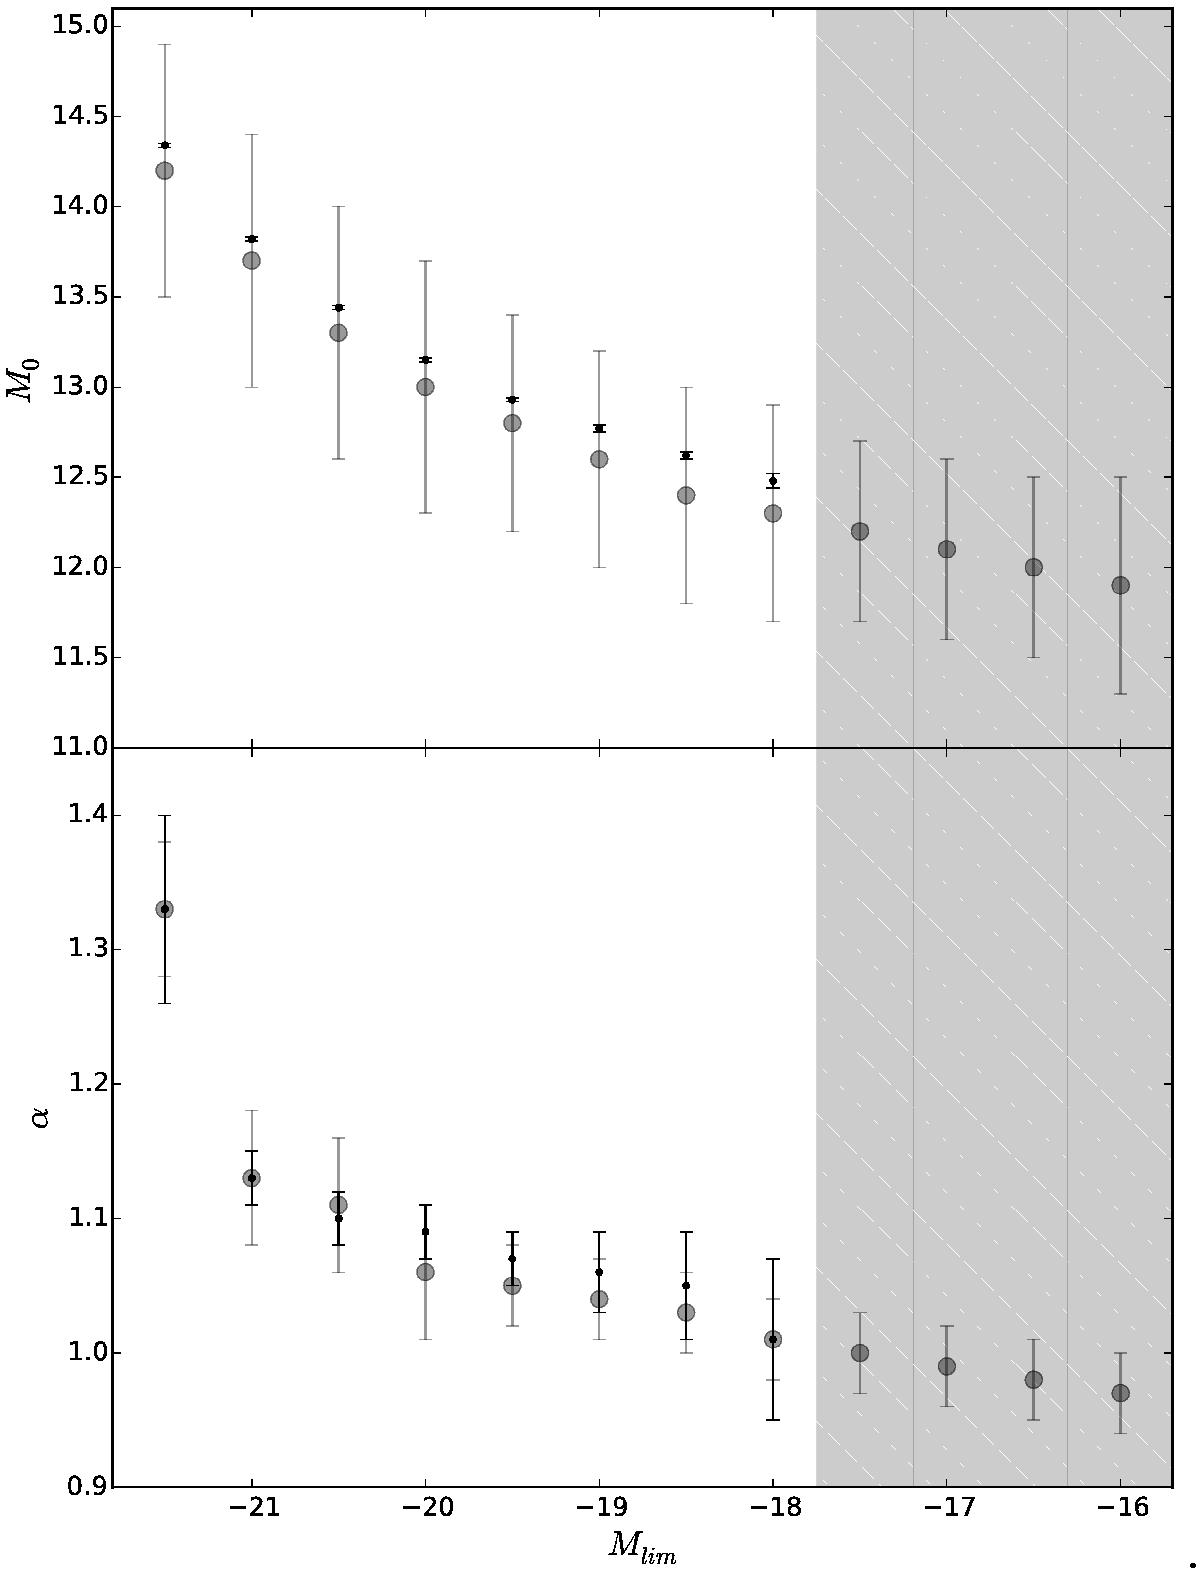
Parameters of HOD for satellite galaxies (see Eq. (4)). Top and bottom panels show M0 and α parameters, respectively, as a function of the limiting magnitude. Our results are shown in grey circles while black circles correspond to results of Yang et al. (2008). There is a good agreement between both results, furthermore our method allows to extend the range of absolute magnitude to fainter values up to Mlim = −16.0 without losing statistical strength (shaded area). Parameters and error bars correspond to the best values obtained following the χ2 minimization method.
Current usage metrics show cumulative count of Article Views (full-text article views including HTML views, PDF and ePub downloads, according to the available data) and Abstracts Views on Vision4Press platform.
Data correspond to usage on the plateform after 2015. The current usage metrics is available 48-96 hours after online publication and is updated daily on week days.
Initial download of the metrics may take a while.