Fig. 4
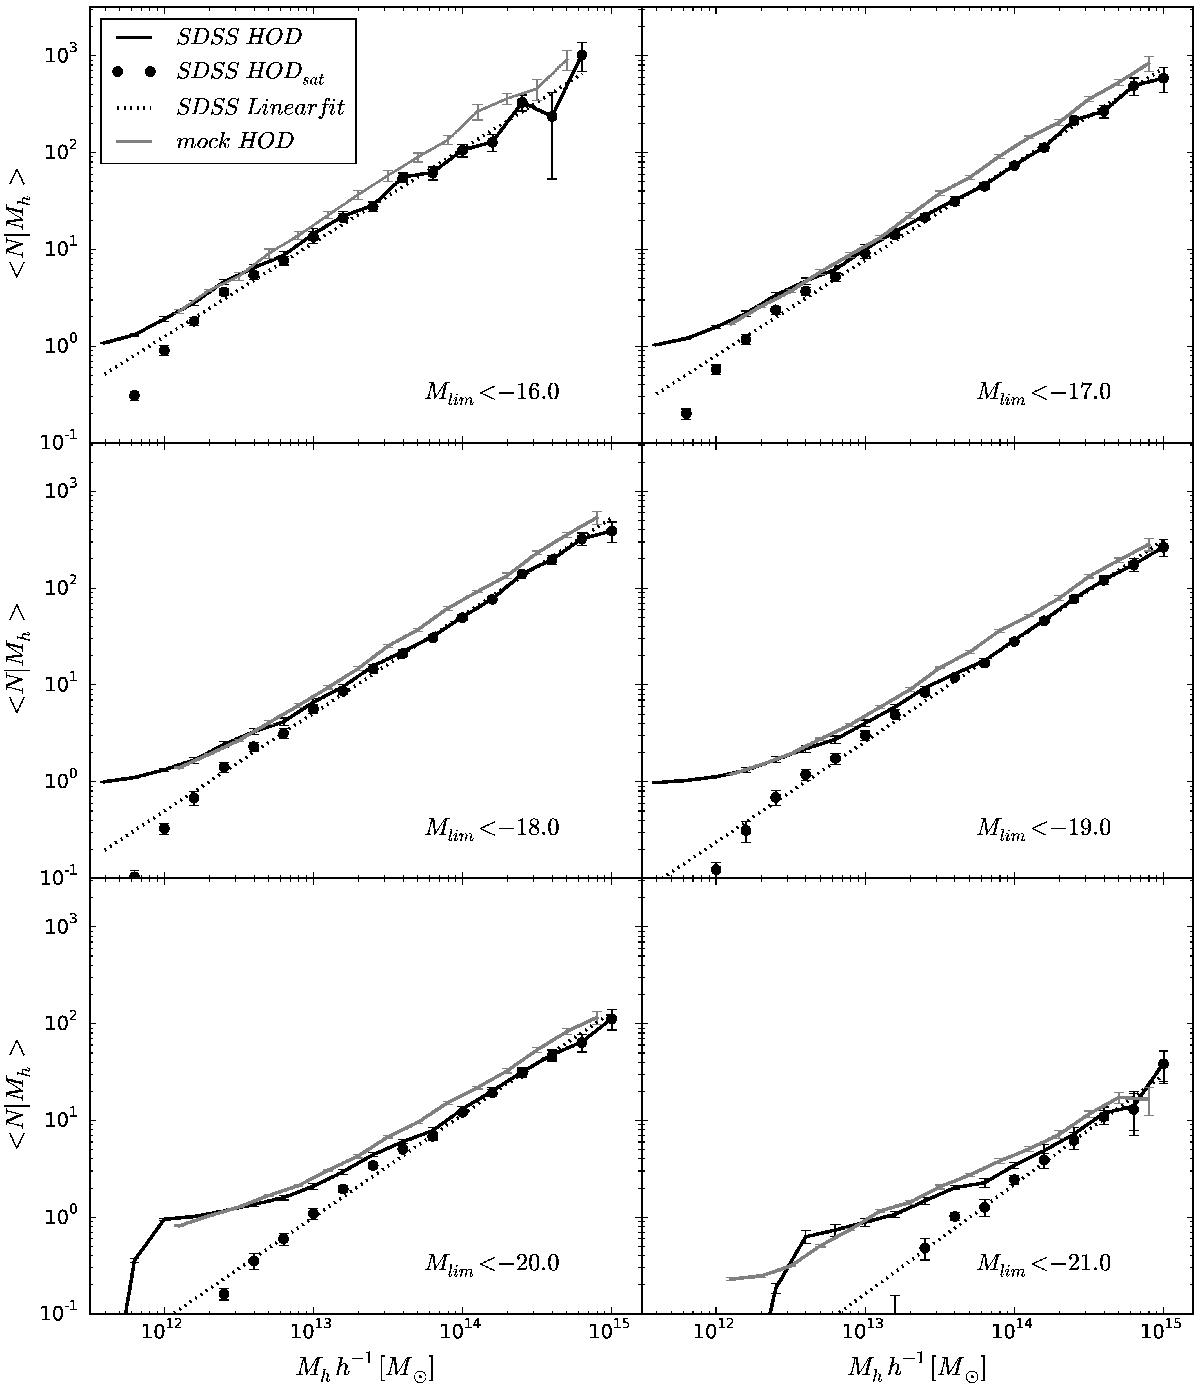
HOD obtained for SDSS DR7 implementing background subtraction method for different limiting absolute magnitude (Mlim = −16.0,−17.0,−18.0,−19.0,−20.0 and −21.0 as indicated in each panel). We show in solid lines the total HOD while solid circles show the satellite distribution. Dotted lines correspond to the best linear fit of satellite distribution. Just for comparison, we included the occupation corresponding to the synthetic catalogue estimated in the previous section (gray lines). Error bars are computed using the standard jackknife procedure.
Current usage metrics show cumulative count of Article Views (full-text article views including HTML views, PDF and ePub downloads, according to the available data) and Abstracts Views on Vision4Press platform.
Data correspond to usage on the plateform after 2015. The current usage metrics is available 48-96 hours after online publication and is updated daily on week days.
Initial download of the metrics may take a while.