Fig. 3
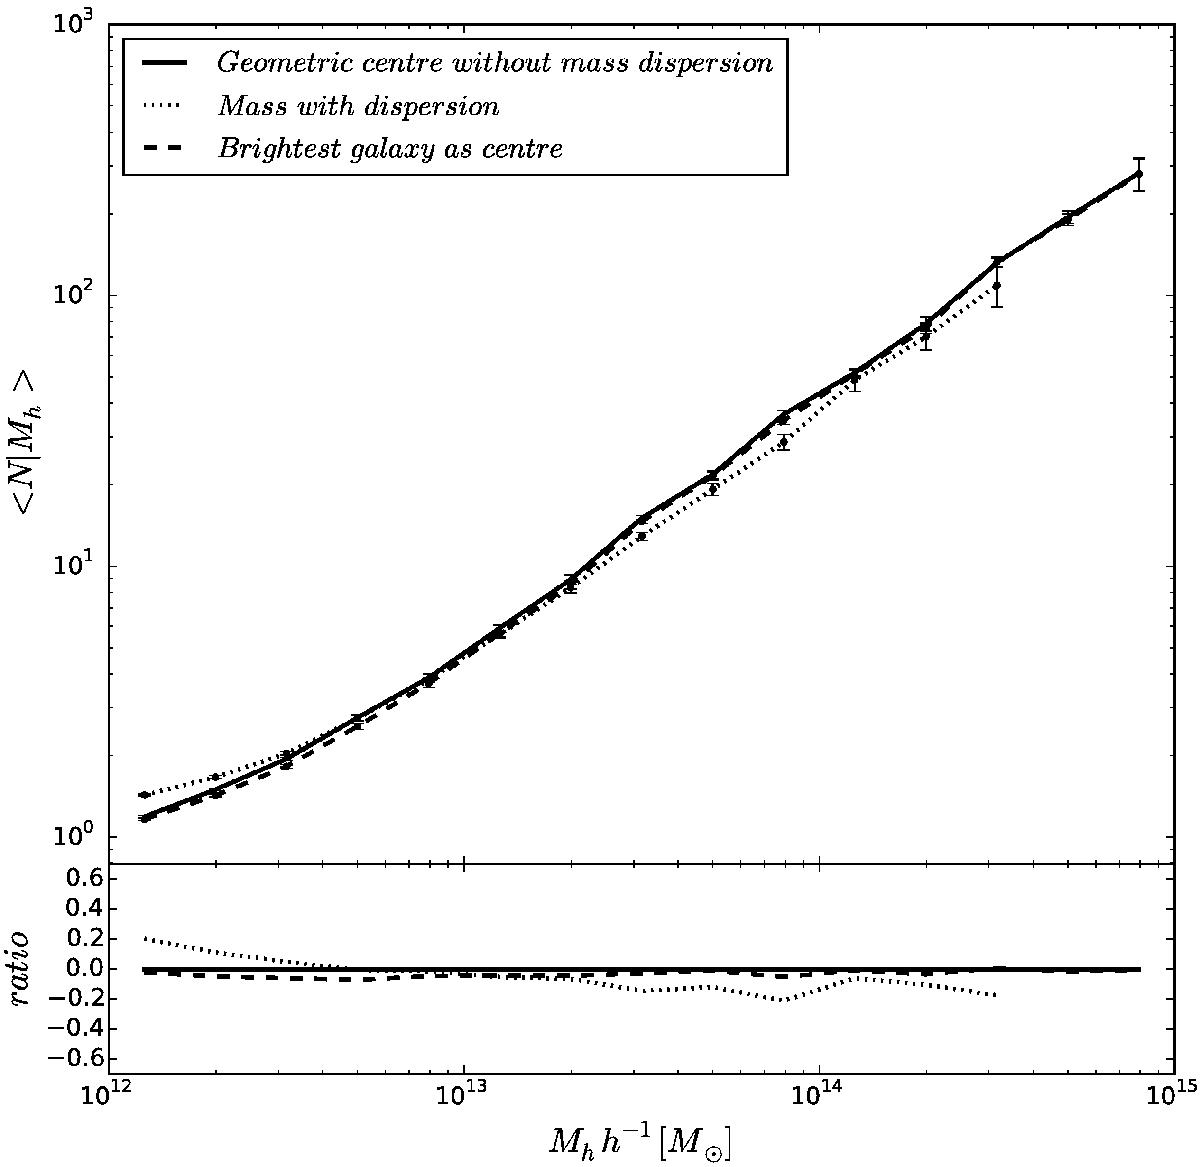
Effects of variations in mass and positions of groups. The dotted line corresponds to the groups with an artificial Gaussian dispersion around the simulated halo masses and the dashed line shows the HOD of groups using the brightest galaxy as centre. The solid line is the HOD of groups in the mock, with geometric centre and masses taken from the simulation, as in previous plots. Errors are determined using a standard jackknife procedure. These results correspond to Mlim = −19.0. The bottom panel shows the quotient between the HOD estimations.
Current usage metrics show cumulative count of Article Views (full-text article views including HTML views, PDF and ePub downloads, according to the available data) and Abstracts Views on Vision4Press platform.
Data correspond to usage on the plateform after 2015. The current usage metrics is available 48-96 hours after online publication and is updated daily on week days.
Initial download of the metrics may take a while.