Fig. 2
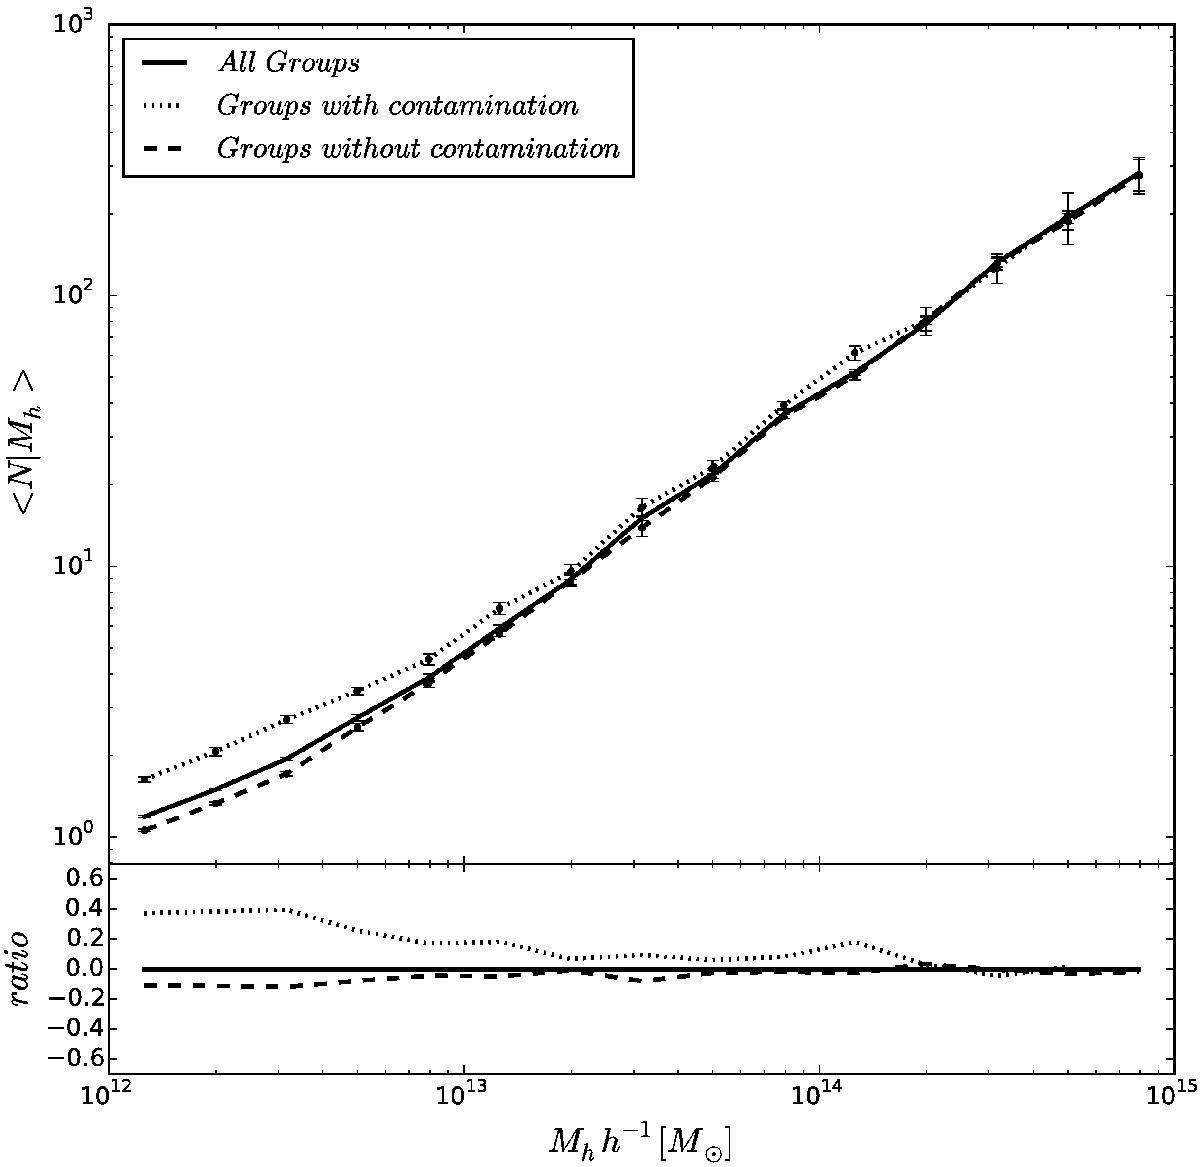
Projection effects in the determination of HOD by the background subtraction method. The dotted line shows the HOD of groups that have, in projections, other groups in the characteristic radius; the dashed line corresponds to the HOD of groups without contamination; and the solid line is the HOD of all groups. A standard jackknife procedure is applied to estimate errors. For the sake of clarity we only plot the results corresponding to Mlim = −19.0. The bottom panel shows the quotient between the HOD estimated with and without contamination and the HOD of all groups.
Current usage metrics show cumulative count of Article Views (full-text article views including HTML views, PDF and ePub downloads, according to the available data) and Abstracts Views on Vision4Press platform.
Data correspond to usage on the plateform after 2015. The current usage metrics is available 48-96 hours after online publication and is updated daily on week days.
Initial download of the metrics may take a while.