Fig. 1
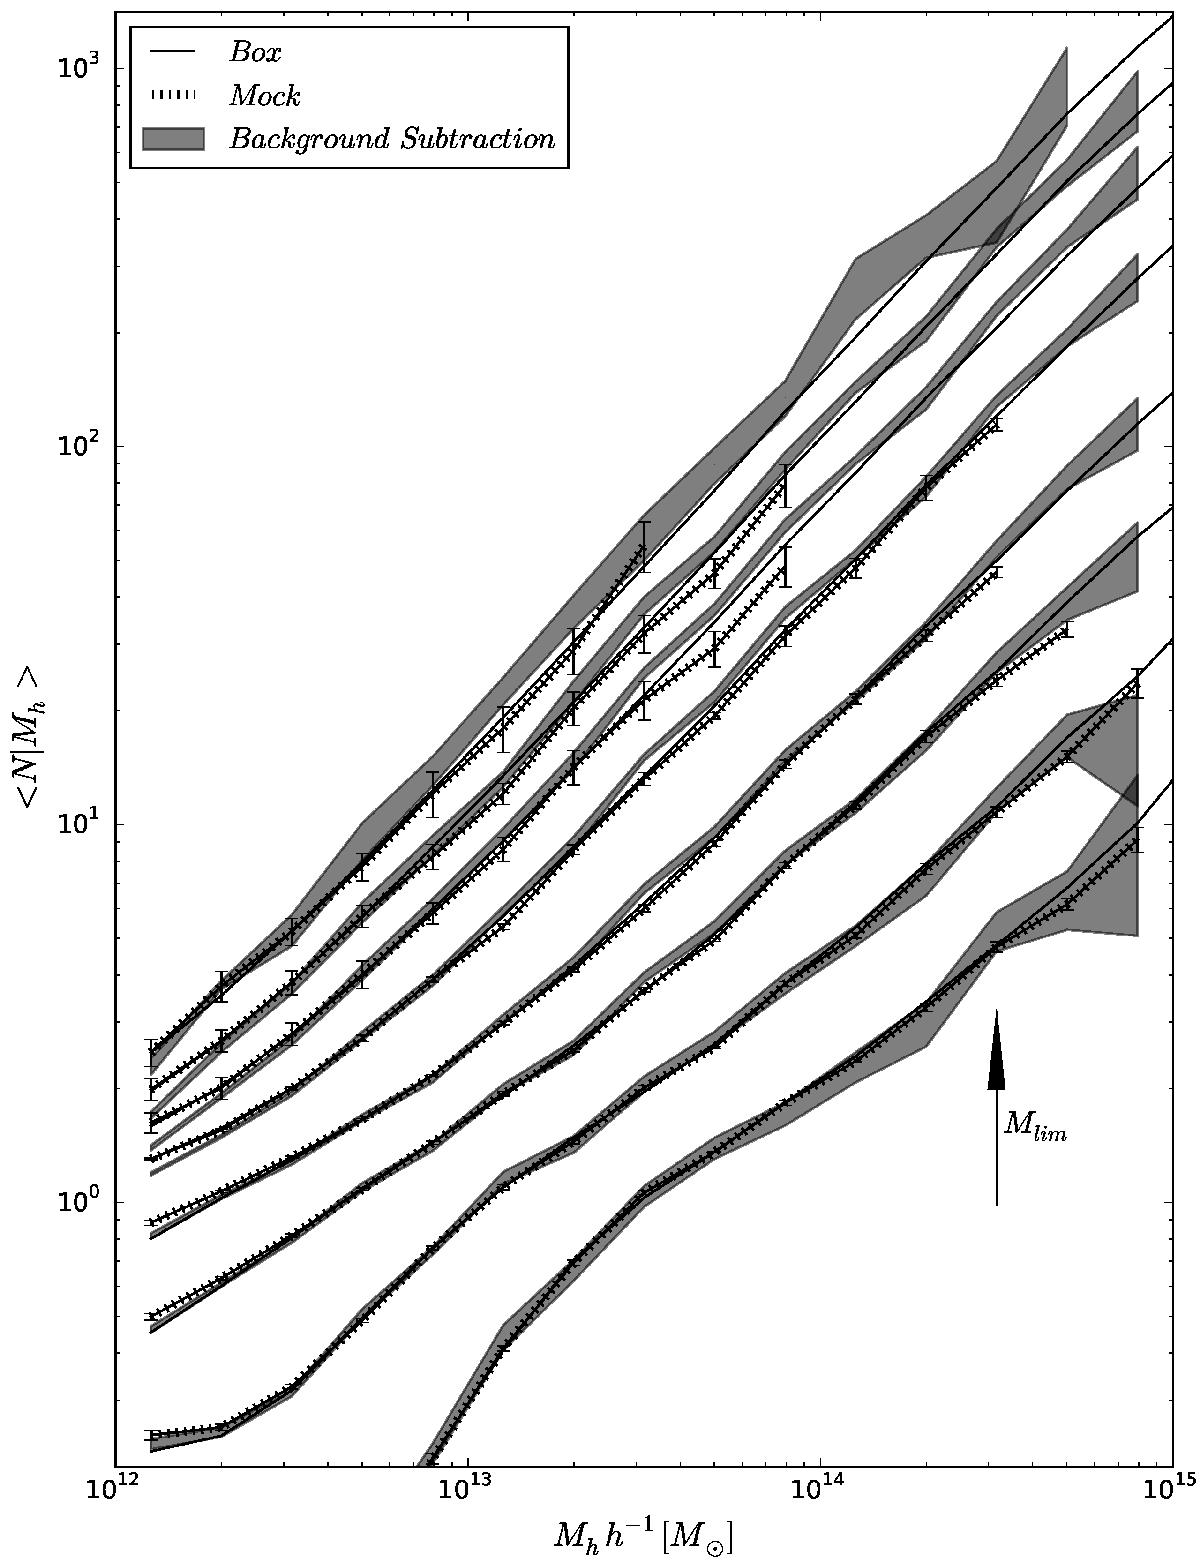
Comparison between HOD obtained by direct counts in volume limited samples (dotted lines), by the background subtraction method (shaded grey bands), and in the simulated box (solid lines). From bottom to top, we show the results for Mlim = −21.5, −21.0, −20.5, −20.0, −19.0, −18.0, −17.0, and −16.0. The errors are computed using the standard jackknife procedure. As can be seen, these results suggest that our method is in good agreement with direct estimation and supports its robustness. It should be taken into account that the proposed method uses both photometric and spectroscopic catalogues, while direct estimation only uses spectroscopic data.
Current usage metrics show cumulative count of Article Views (full-text article views including HTML views, PDF and ePub downloads, according to the available data) and Abstracts Views on Vision4Press platform.
Data correspond to usage on the plateform after 2015. The current usage metrics is available 48-96 hours after online publication and is updated daily on week days.
Initial download of the metrics may take a while.