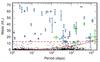
Fig. 8
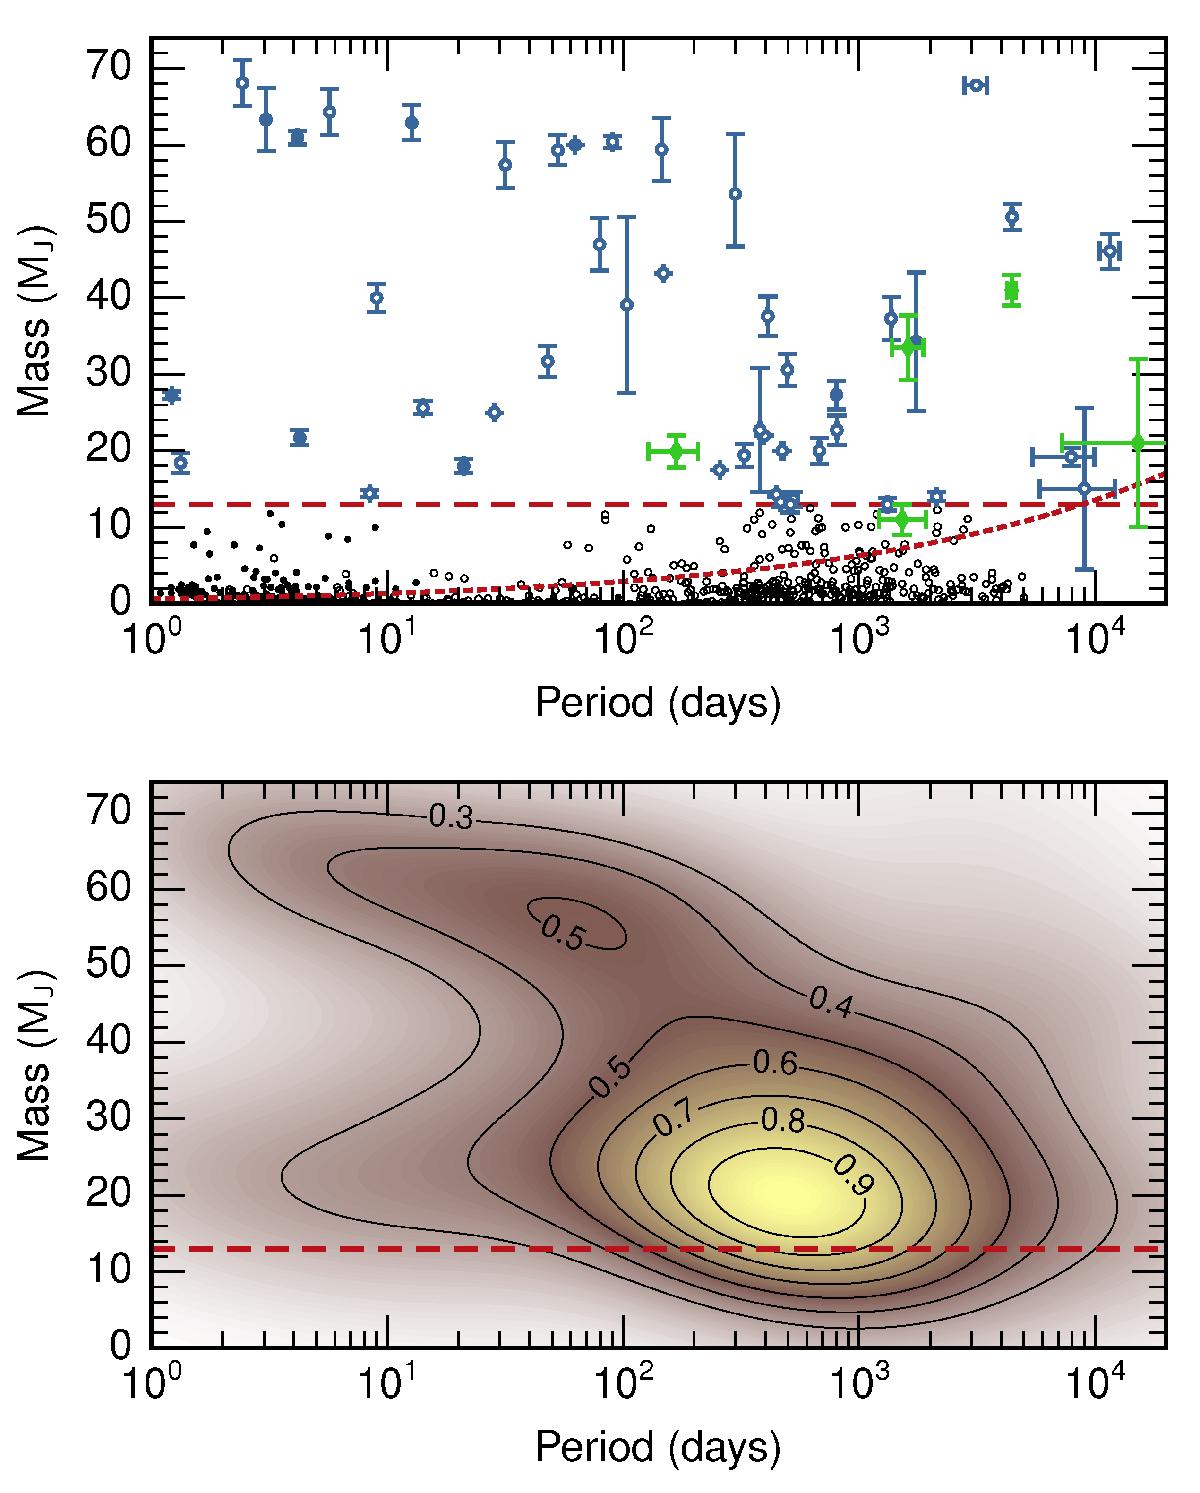
Upper panel: mass-period diagram with brown dwarfs companions detected through radial velocity, transit and direct imaging (blue filled circles for measured masses, and open circles for minimum masses; list adapted from Ma & Ge 2014), and microlensing (green diamonds). For reference, exoplanets detected so far are also displayed (small black circles, http://exoplanets.org). The red dotted line indicates the global radial velocity completeness limit, while the red dashed line marks the region above which data are included to perform the non-parametric, two-dimensional probability density distribution shown in the lower panel.
Current usage metrics show cumulative count of Article Views (full-text article views including HTML views, PDF and ePub downloads, according to the available data) and Abstracts Views on Vision4Press platform.
Data correspond to usage on the plateform after 2015. The current usage metrics is available 48-96 hours after online publication and is updated daily on week days.
Initial download of the metrics may take a while.