Fig. 6
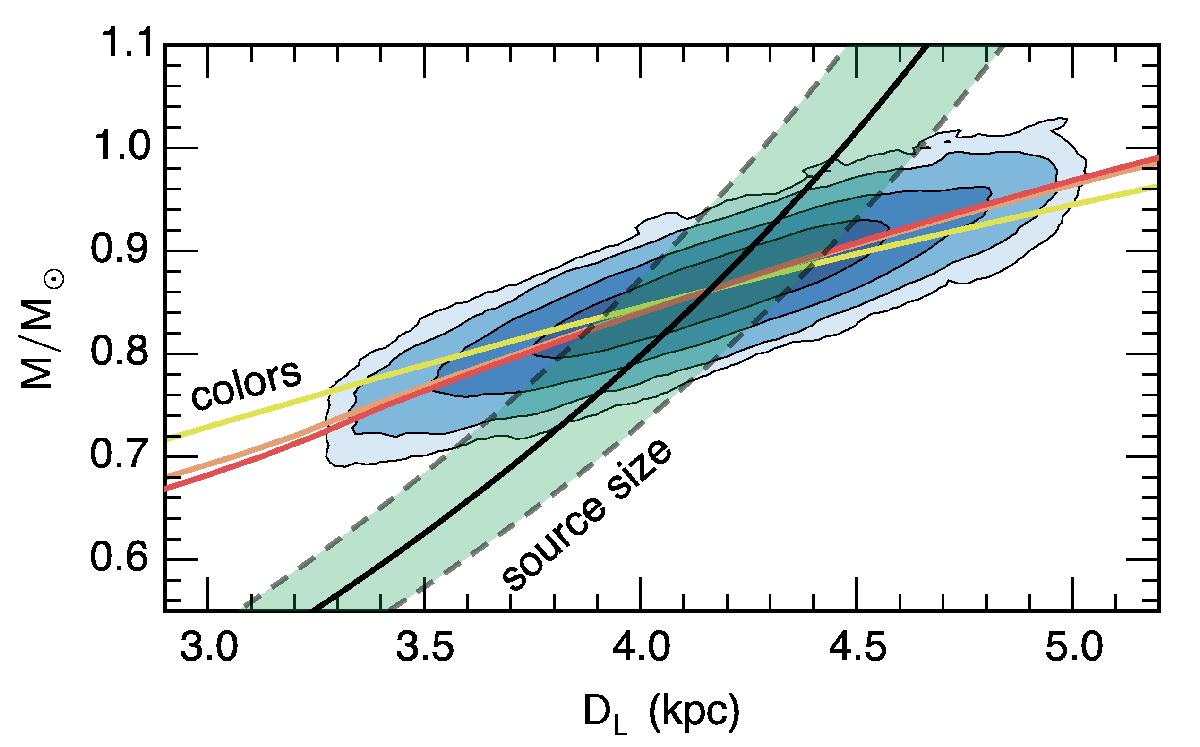
Lens mass-distance relations derived from the source size ρ (1σ around the best value shown by the green shadow limited by the dashed lines) and NaCo (J,H,Ks) colours constrains (respectively yellow, orange, red from top to bottom below the label “colours”). The blue contours (1−4σ) represent the joint posterior probability density P(M,DL) from the MCMC run.
Current usage metrics show cumulative count of Article Views (full-text article views including HTML views, PDF and ePub downloads, according to the available data) and Abstracts Views on Vision4Press platform.
Data correspond to usage on the plateform after 2015. The current usage metrics is available 48-96 hours after online publication and is updated daily on week days.
Initial download of the metrics may take a while.