Fig. 3
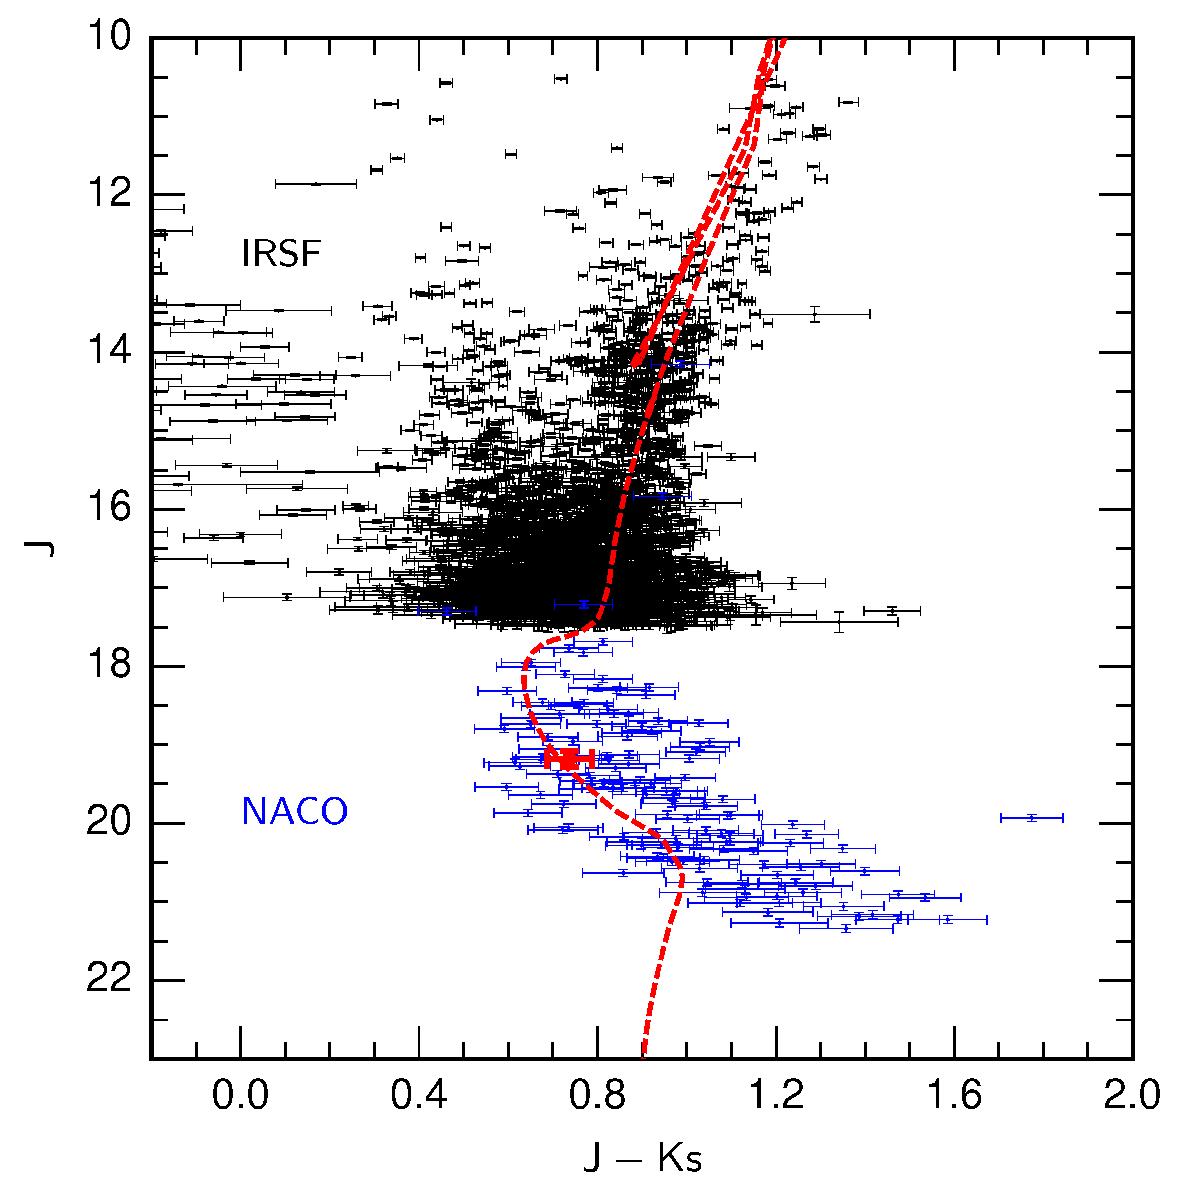
(J,J − Ks) colour–magnitude diagram in the 2MASS system combining NaCo and IRSF data (respectively, in blue and black). The red dot is the magnitude/colour of the source derived from the source characterisation (Sect. 4.1). The values are not corrected for interstellar extinction. The red clump (RCG) is fitted by the red over-plotted 10 Gyr, solar-metallicity isochrone from Bressan et al. (2012).
Current usage metrics show cumulative count of Article Views (full-text article views including HTML views, PDF and ePub downloads, according to the available data) and Abstracts Views on Vision4Press platform.
Data correspond to usage on the plateform after 2015. The current usage metrics is available 48-96 hours after online publication and is updated daily on week days.
Initial download of the metrics may take a while.