Fig. 1
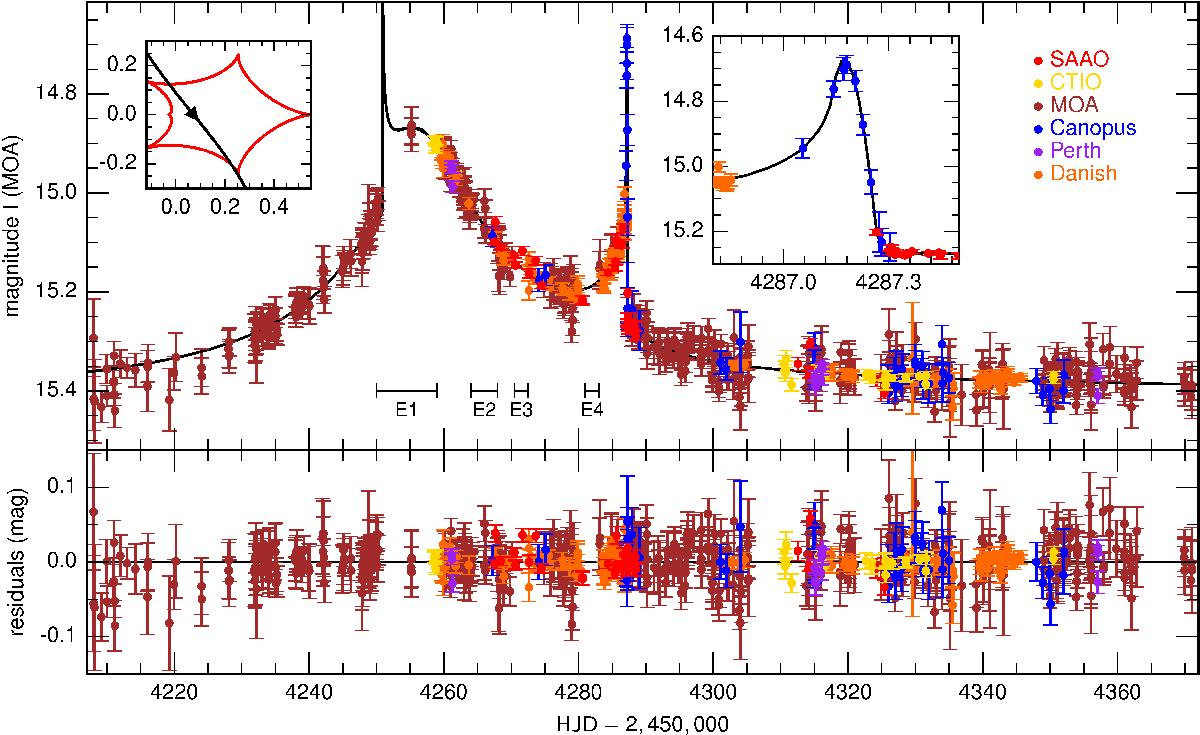
Upper panel: the light curve of MOA-2007-BLG-197 and the best-fit model (solid line) with a zoom on the caustic exit on the right-hand side. On the left-hand side, the structure of the resonant caustic is drawn in red, as well as the trajectory of the source, in black (axes are in Einstein radius units). The source is too small to be distinguished. The four intervals E1−4 indicate time intervals where possible source caustic crossing (caustic entry) have been investigated. Lower panel: the residuals of the best-fit model.
Current usage metrics show cumulative count of Article Views (full-text article views including HTML views, PDF and ePub downloads, according to the available data) and Abstracts Views on Vision4Press platform.
Data correspond to usage on the plateform after 2015. The current usage metrics is available 48-96 hours after online publication and is updated daily on week days.
Initial download of the metrics may take a while.