Fig. 5
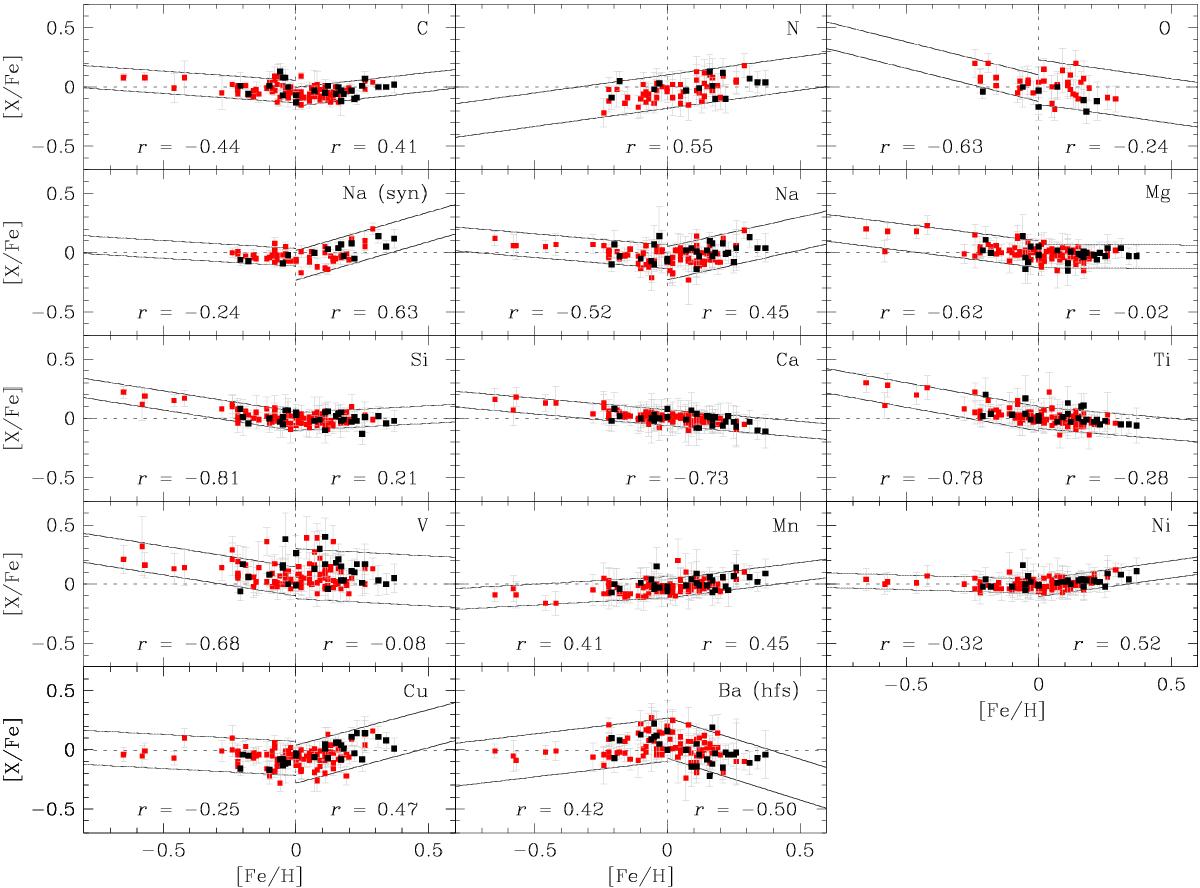
Abundance ratios as a function of metallicity for our sample of 120 dwarf stars of the thin-disk population. Stars with planets are represented by black symbols. For sodium, the abundance ratios from both spectral synthesis and equivalent widths determination are plotted. The 95% confidence intervals (solid lines) around linear regressions, and their respective correlation coefficients (r) are also shown. The linear regressions were derived either for [Fe/H] ≤ 0, [Fe/H] ≥ 0, or for the whole metallicity range, depending on which one has the more significant slope.
Current usage metrics show cumulative count of Article Views (full-text article views including HTML views, PDF and ePub downloads, according to the available data) and Abstracts Views on Vision4Press platform.
Data correspond to usage on the plateform after 2015. The current usage metrics is available 48-96 hours after online publication and is updated daily on week days.
Initial download of the metrics may take a while.