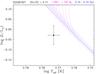
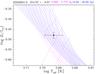
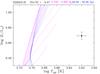
Fig. 4
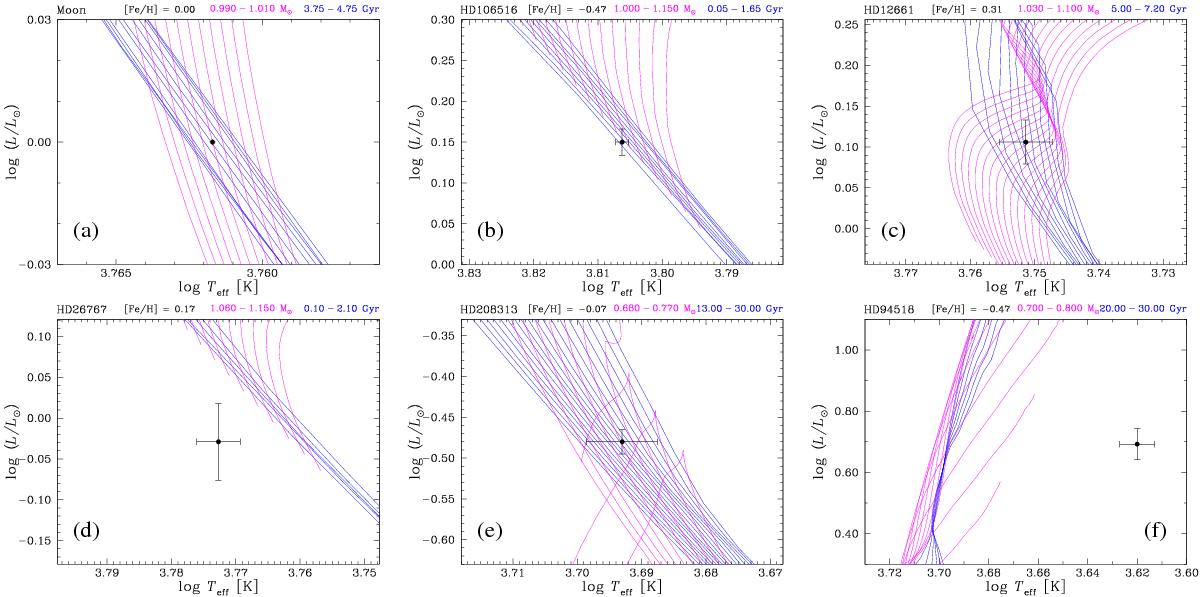
Evolutionary tracks (magenta lines) and isochrones (blue lines) from Yonsei-Yale, calculated for different values of metallicity, showing how we derived the stellar masses and ages. The ranges of age (increasing from left to right, HD 94518 excepted) and mass (increasing from right to left, HD 94518 excepted) of the models plotted are indicated on the top of each panel.
Current usage metrics show cumulative count of Article Views (full-text article views including HTML views, PDF and ePub downloads, according to the available data) and Abstracts Views on Vision4Press platform.
Data correspond to usage on the plateform after 2015. The current usage metrics is available 48-96 hours after online publication and is updated daily on week days.
Initial download of the metrics may take a while.