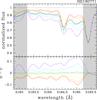
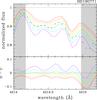
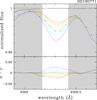
Fig. 2
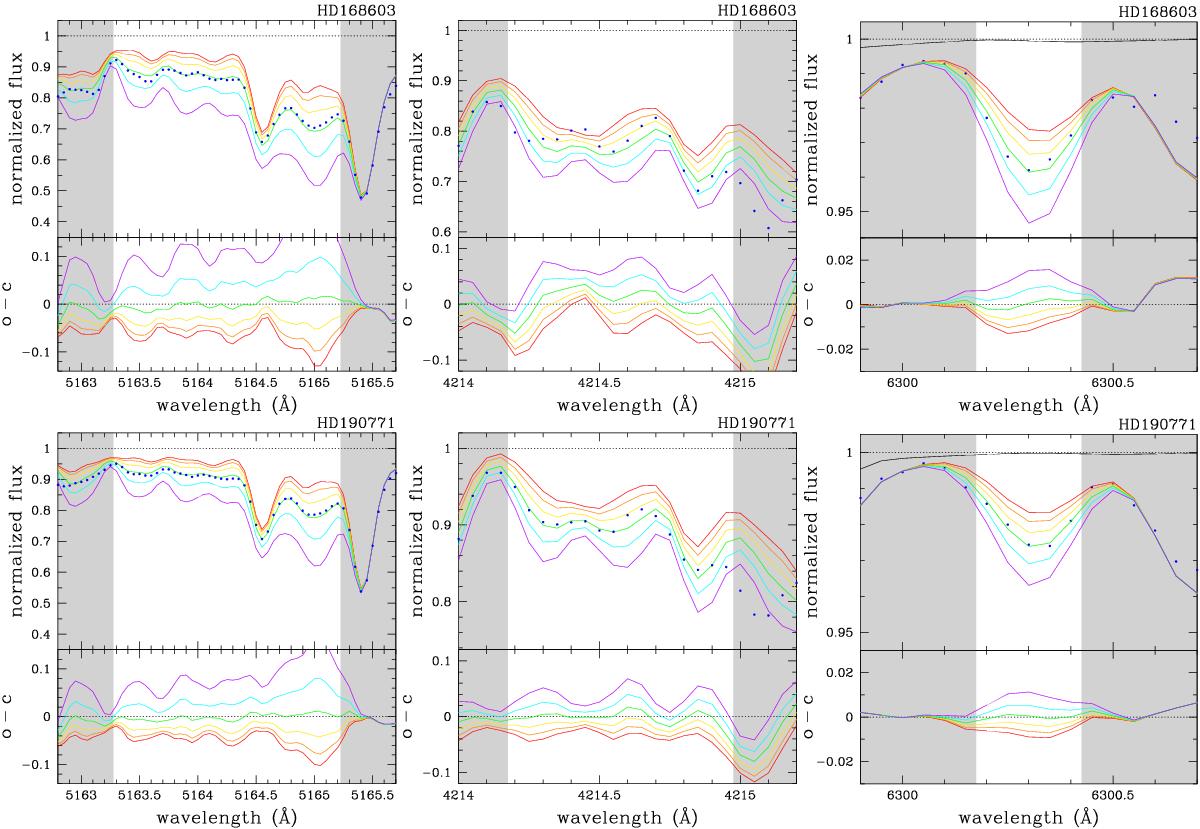
Synthesis of three spectral regions: C2 (λ5165, left panels) and CN (λ4215, middle panels) molecular band heads, and the O atomic line at λ6300.30 (right panels). Two dwarf stars with different values of spectral S/N are shown: HD 168603 (S/N = 156, Teff = 5399 K, [Fe/H] = 0.11 dex, top panels) and HD 190771 (S/N = 299, Teff = 5817 K, [Fe/H] = 0.14 dex, bottom panels). These are the S/N per pixel computed at λ5550. Six spectra computed for different abundances (the N abundance is changed in the case of the CN band) and separated by 0.1 dex are plotted. The differences between observed and computed spectra (O−C) are also plotted in the bottom of each panel.
Current usage metrics show cumulative count of Article Views (full-text article views including HTML views, PDF and ePub downloads, according to the available data) and Abstracts Views on Vision4Press platform.
Data correspond to usage on the plateform after 2015. The current usage metrics is available 48-96 hours after online publication and is updated daily on week days.
Initial download of the metrics may take a while.