Fig. 13
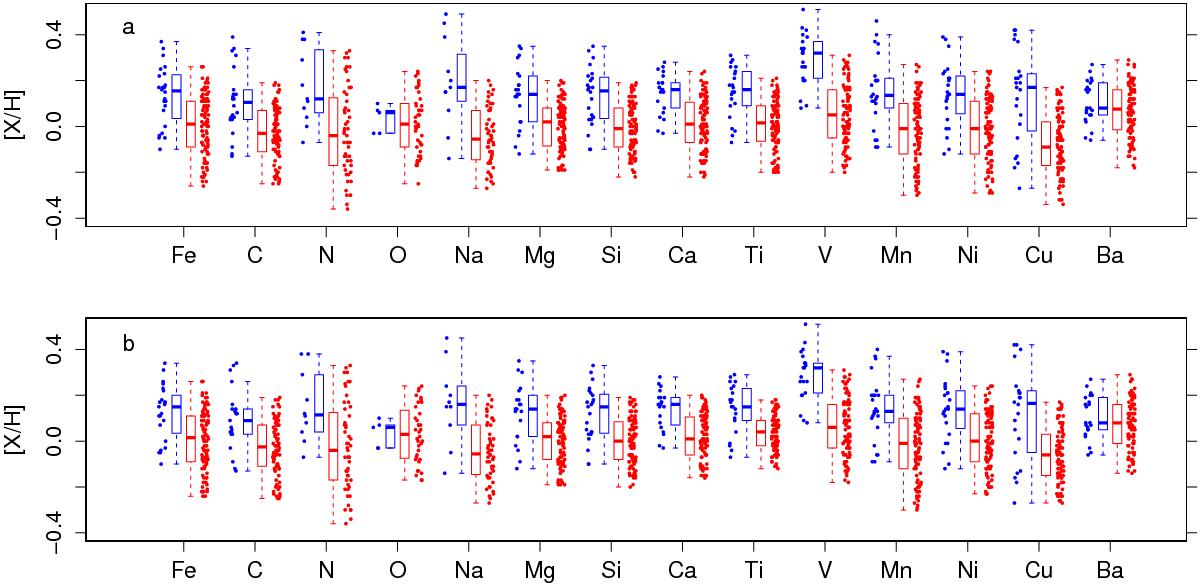
Boxplot for the comparison between the elemental abundances of dwarf stars with and without planets, shown in blue and red, respectively. Two-sigma clipping was applied to all abundance distributions before the comparison, to avoid abundance outliers. The top panel shows the distributions for dwarfs in the whole [Fe/H] abundance space, whereas the bottom panel restricts the comparison to those stars having −0.25 ≤ [Fe/H] <+0.35. The original data points are shown beside each corresponding box to allow visualization of the intrinsic scatter.
Current usage metrics show cumulative count of Article Views (full-text article views including HTML views, PDF and ePub downloads, according to the available data) and Abstracts Views on Vision4Press platform.
Data correspond to usage on the plateform after 2015. The current usage metrics is available 48-96 hours after online publication and is updated daily on week days.
Initial download of the metrics may take a while.