Fig. 12
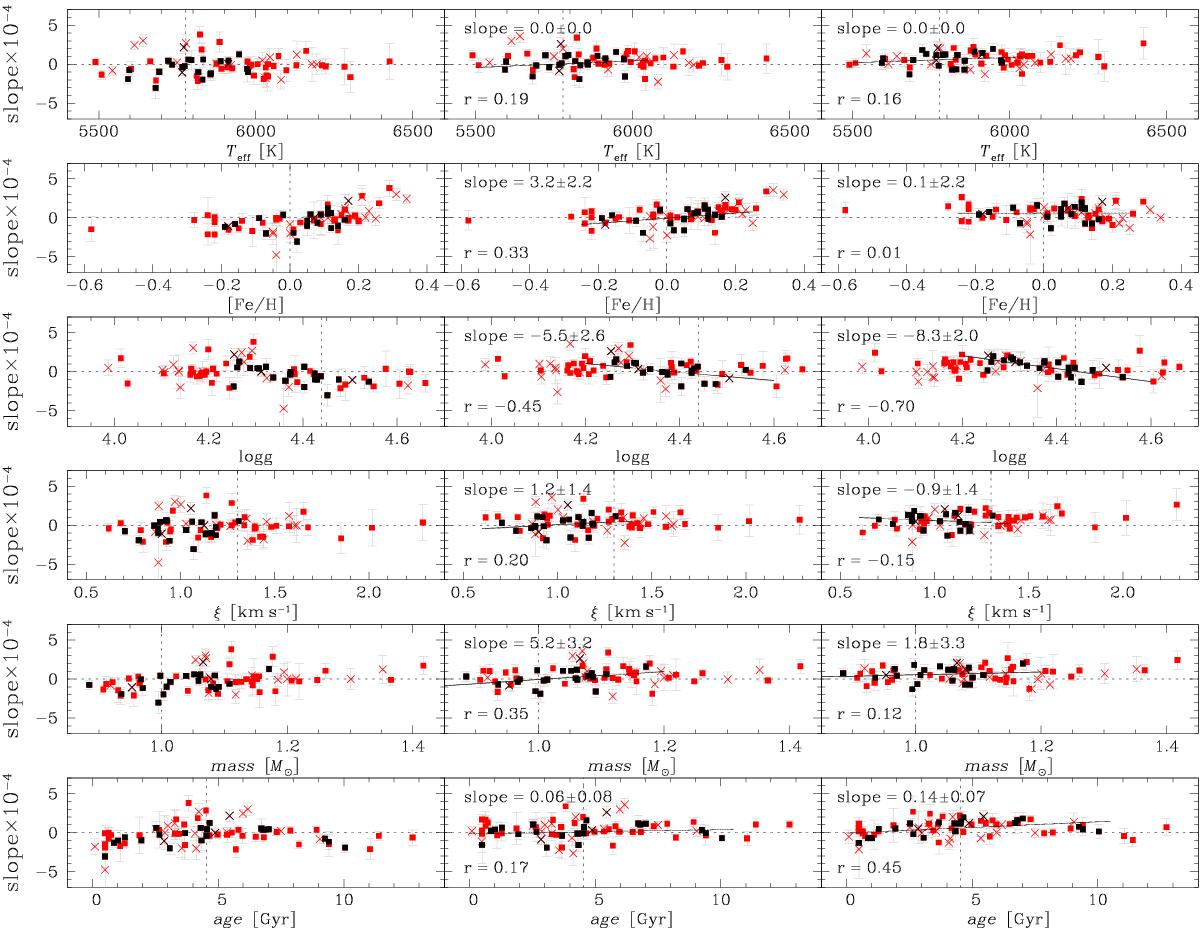
Slope of the regressions computed in the diagrams Δ[X/Fe] vs. TC (Fig. 11) plotted as a function of the derived stellar parameters. We show possible trends before (left panels) and after applying the corrections for the Galactic chemical evolution effects based on age (middle panels) and on metallicity (right panels). Dwarf stars of the thin disk population are separated in solar analogs (black symbols) and non-solar analogs (red symbols) Stars with planets are indicated by crosses. The slopes of linear regressions (solid lines) applied to the solar analogs and their respective correlation coefficients (r) are also shown.
Current usage metrics show cumulative count of Article Views (full-text article views including HTML views, PDF and ePub downloads, according to the available data) and Abstracts Views on Vision4Press platform.
Data correspond to usage on the plateform after 2015. The current usage metrics is available 48-96 hours after online publication and is updated daily on week days.
Initial download of the metrics may take a while.