Fig. 1
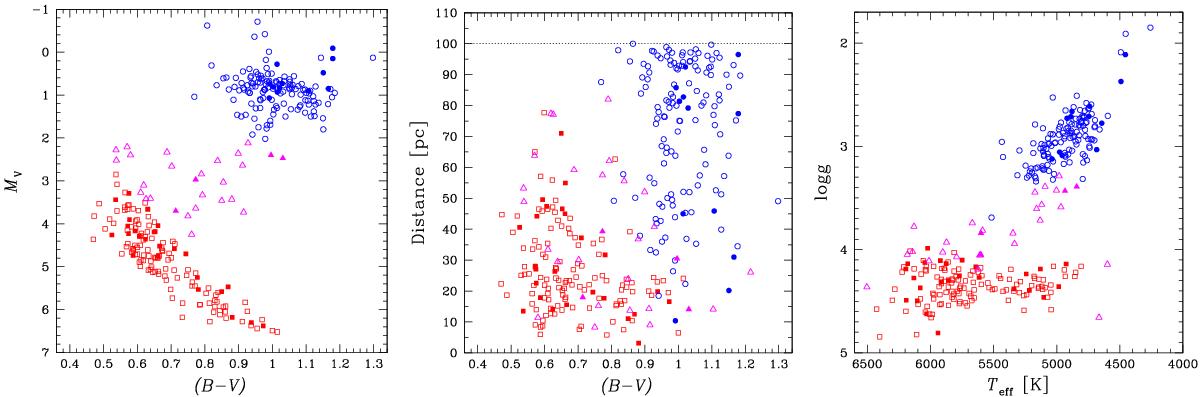
Hertzsprung-Russell (left panel) and color-distance (middle panel) diagrams for our sample of 140 dwarfs (□), 29 subgiants (△), and 140 giants (°). The derived stellar parameters are also shown in a log g vs. Teff diagram (right panel) for comparison. Filled symbols represent stars with detected planets. The distance limit of 100 pc is represented by the dotted line.
Current usage metrics show cumulative count of Article Views (full-text article views including HTML views, PDF and ePub downloads, according to the available data) and Abstracts Views on Vision4Press platform.
Data correspond to usage on the plateform after 2015. The current usage metrics is available 48-96 hours after online publication and is updated daily on week days.
Initial download of the metrics may take a while.