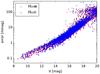
Fig. 6
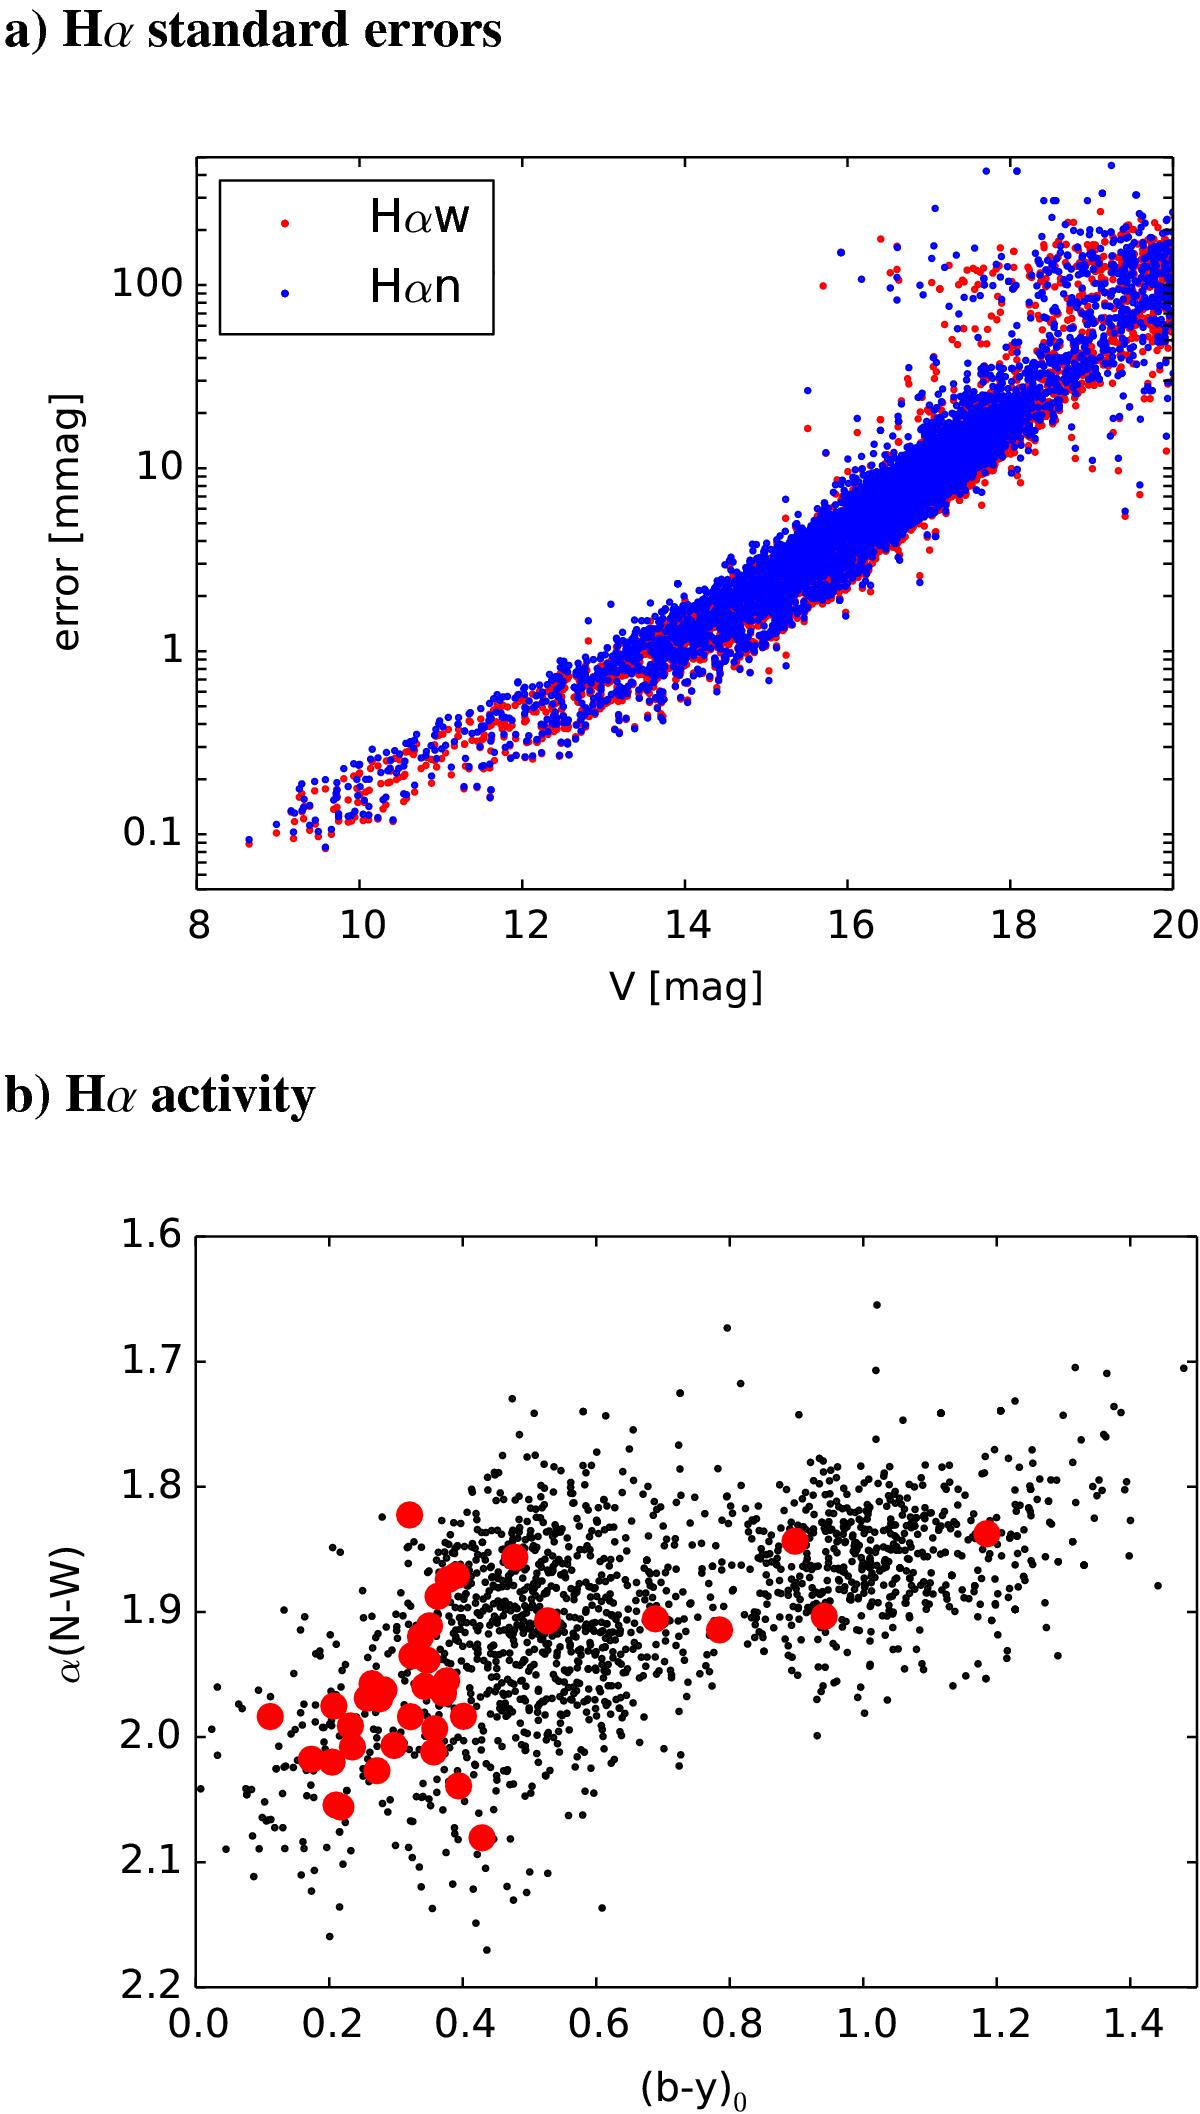
Hα photometry of IC 4756. a) Standard errors in the STELLA Hα CCD data for both filters (n narrow, w wide). b) Hα index α versus de-reddened b−y color; an activity analog of the H–R diagram. Hα emission increases upward, Hα absorption increases downward. The thick dots indicate the CoRoT stars from Table 1. Spectral type and color equivalents are dF0, ![]() ; dK0
; dK0 ![]() ; dM,
; dM, ![]() .
.
Current usage metrics show cumulative count of Article Views (full-text article views including HTML views, PDF and ePub downloads, according to the available data) and Abstracts Views on Vision4Press platform.
Data correspond to usage on the plateform after 2015. The current usage metrics is available 48-96 hours after online publication and is updated daily on week days.
Initial download of the metrics may take a while.