Free Access
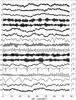
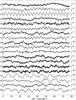
Fig. 1

CoRoT light curves for the target stars from Table 1. The running number on the left side of the plots identifies each star. The numbers on the right side of each plot indicate the scale (varying from star to star) in millimag. Star #2 is missing because CoRoT photometry could not be obtained for it.
This figure is made of several images, please see below:
Current usage metrics show cumulative count of Article Views (full-text article views including HTML views, PDF and ePub downloads, according to the available data) and Abstracts Views on Vision4Press platform.
Data correspond to usage on the plateform after 2015. The current usage metrics is available 48-96 hours after online publication and is updated daily on week days.
Initial download of the metrics may take a while.