Fig. 3
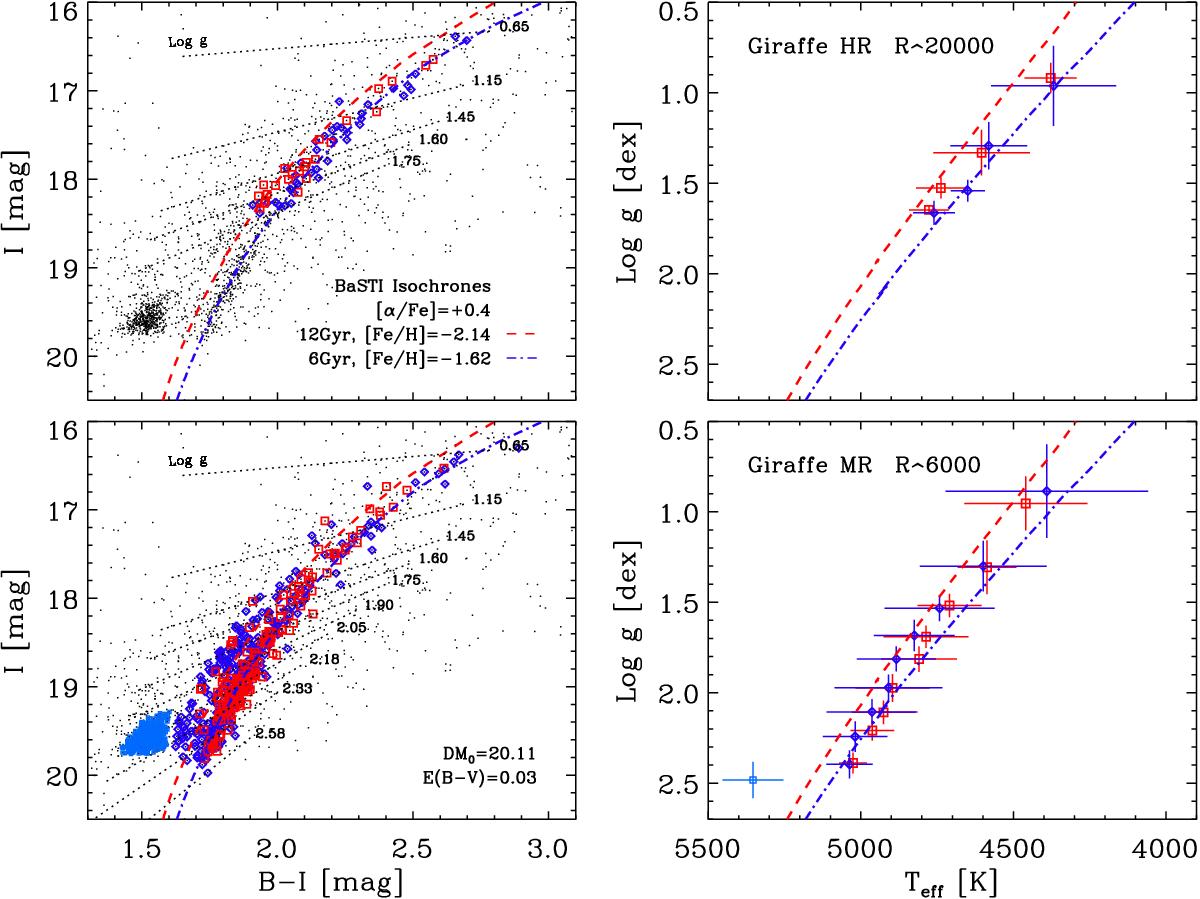
Left column: I vs. B – I CMDs showing stars with Giraffe HR (top) or MR (bottom) spectra. Red squares and blue diamonds show the old and intermediate-age stellar components. Dotted lines mark the boundaries of the gravity bins adopted for the spectrum-stacking procedure. Two isochrones from the BaSTI database (Pietrinferni et al. 2004, 2006) are shown as red dashed and blue dot-dashed lines. The adopted distance modulus and reddening are indicated (Coppola et al. 2013). Right column: colored symbols show the positions of the stacked spectra in the stellar parameter log g vs. Teff plane.
Current usage metrics show cumulative count of Article Views (full-text article views including HTML views, PDF and ePub downloads, according to the available data) and Abstracts Views on Vision4Press platform.
Data correspond to usage on the plateform after 2015. The current usage metrics is available 48-96 hours after online publication and is updated daily on week days.
Initial download of the metrics may take a while.