Fig. 11
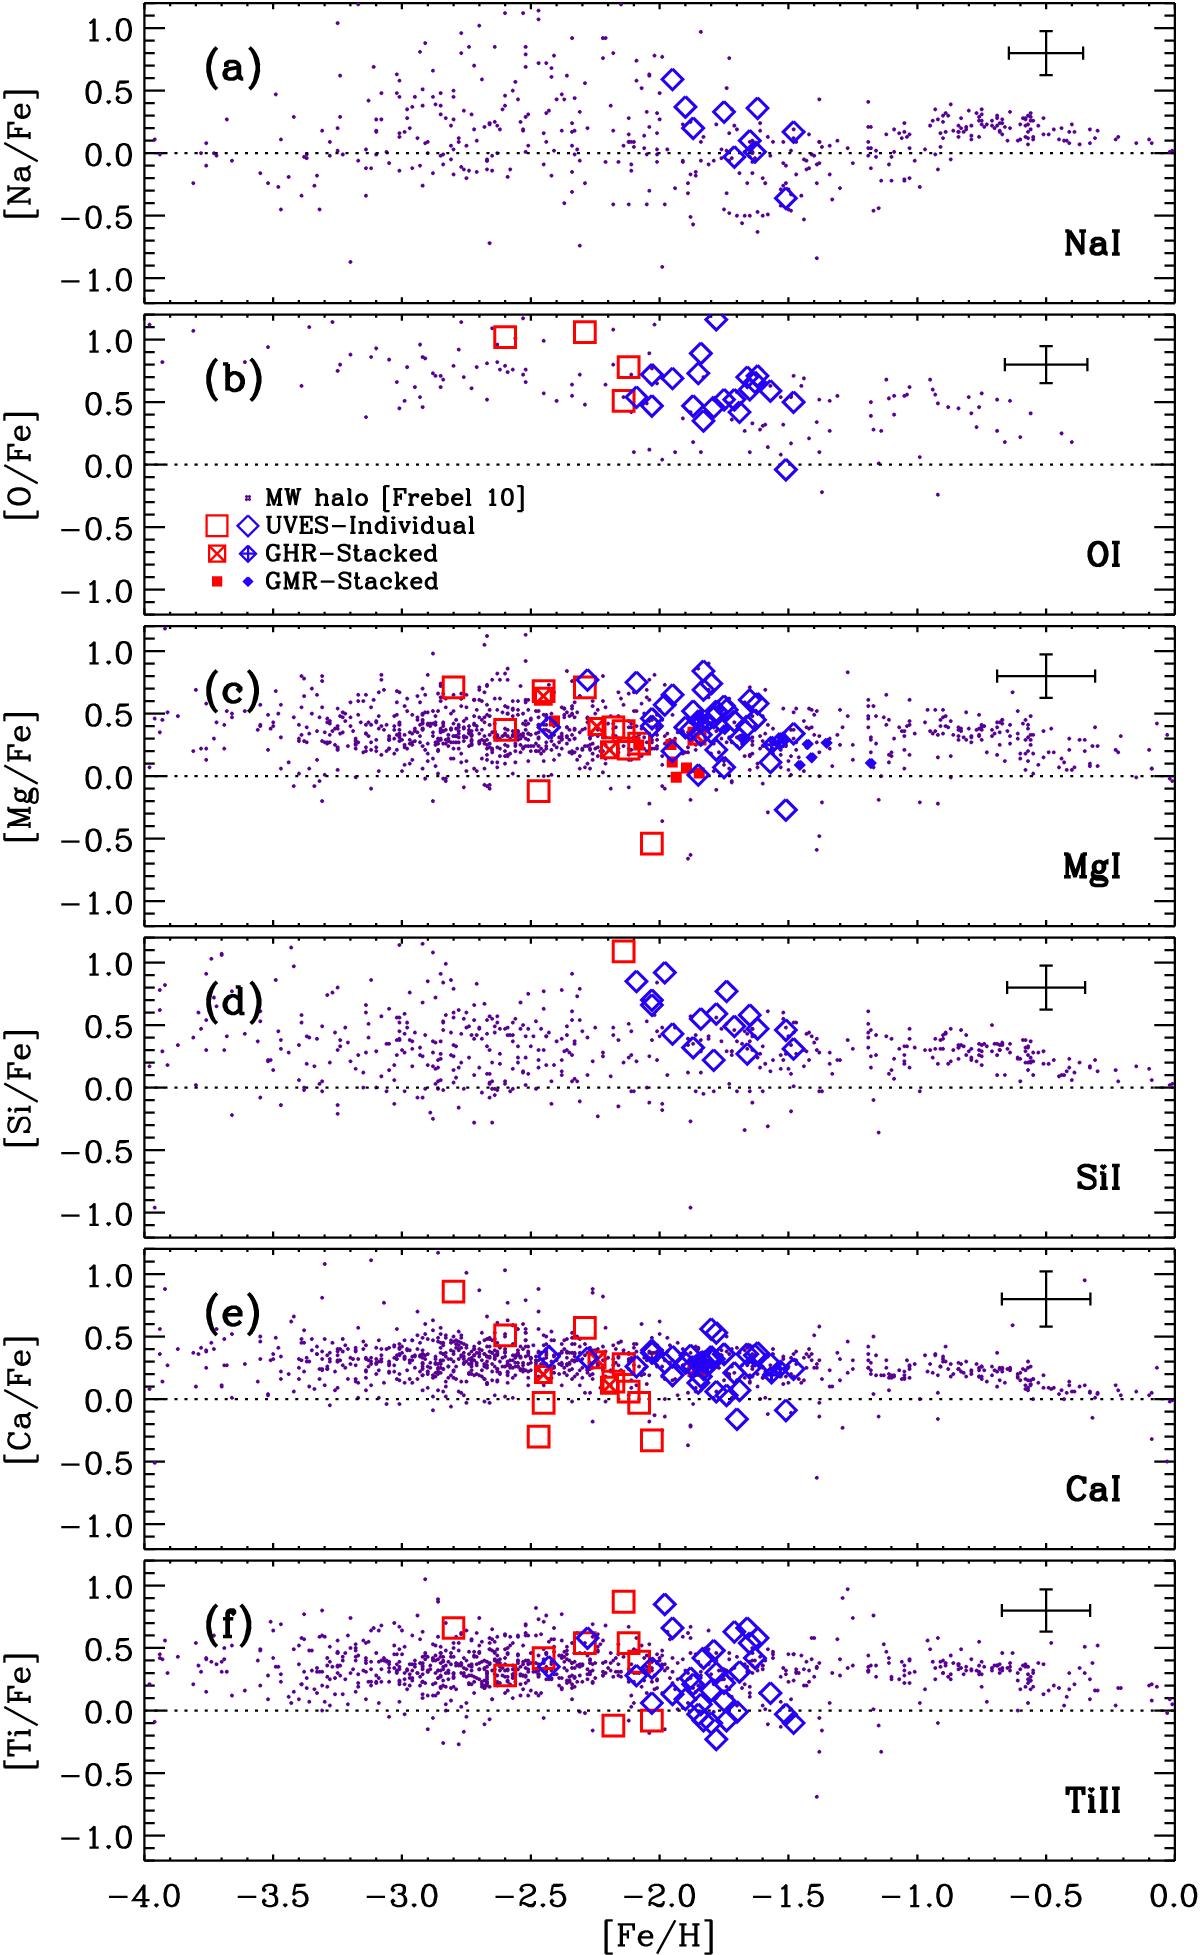
Element abundances as function of [Fe/H]. The open red squares and blue diamonds are the measurements based on UVES spectra of this work for the old and intermediate-age populations. The crossed squares and diamonds show the measurements based on Giraffe-HR spectra, while small solid symbols are for the Giraffe-MR sample. The purple dots show the Milky Way halo stars from Frebel (2010).
Current usage metrics show cumulative count of Article Views (full-text article views including HTML views, PDF and ePub downloads, according to the available data) and Abstracts Views on Vision4Press platform.
Data correspond to usage on the plateform after 2015. The current usage metrics is available 48-96 hours after online publication and is updated daily on week days.
Initial download of the metrics may take a while.