Fig. 10
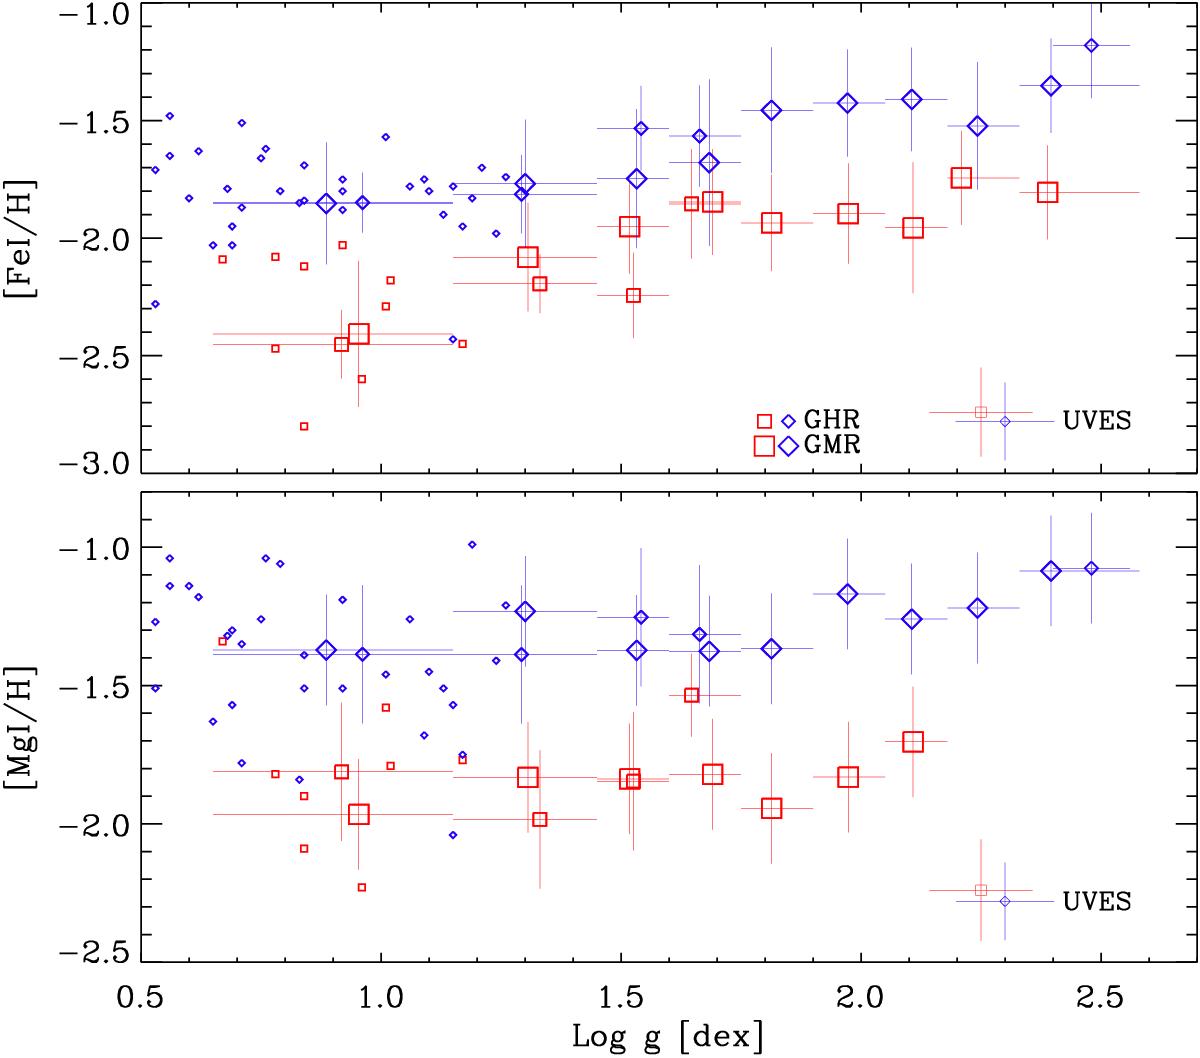
Top: [Fe/H] abundances based on individual and stacked spectra. Red squares and blue diamonds represent abundances of old and intermediate-age stars. Abundances based on individual high-resolution UVES spectra are displayed as small squares and diamonds, without bars. The error bars plotted in the bottom right corner of the panel display the typical uncertainty for the UVES abundances and on surface gravities (see also Paper V). Abundances based on GHR spectra are marked by medium squares and diamonds, while those based on GMR spectra are marked by large squares/diamonds. The vertical bars represent the uncertainty in iron while the horizontal ones show the gravity ranges adopted in Fig. 3. Bottom: same as the top, but for the [Mg/H] abundances.
Current usage metrics show cumulative count of Article Views (full-text article views including HTML views, PDF and ePub downloads, according to the available data) and Abstracts Views on Vision4Press platform.
Data correspond to usage on the plateform after 2015. The current usage metrics is available 48-96 hours after online publication and is updated daily on week days.
Initial download of the metrics may take a while.