Fig. B.1
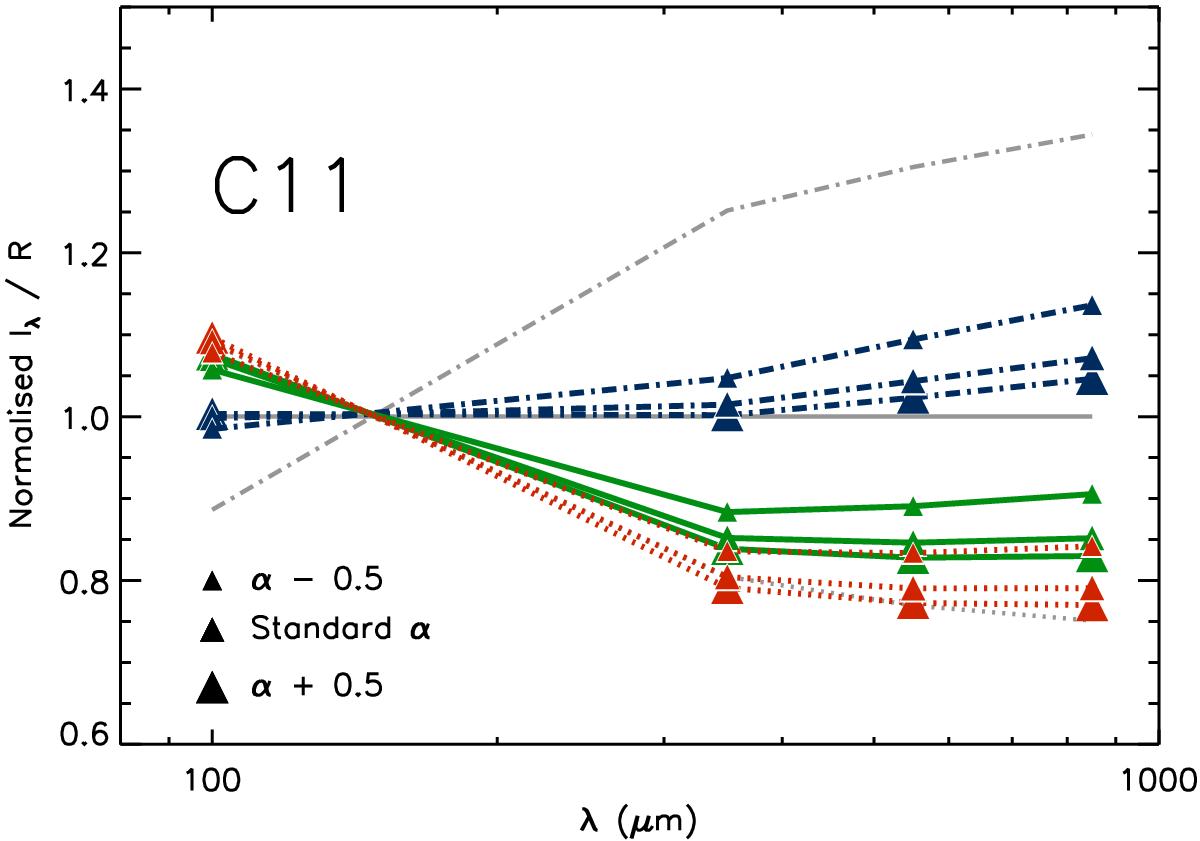
Effect of the grain size distribution on Iλ/ ℛ, as predicted by the C11 model. The SEDs shown are the coldest (blue dot-dashed line), the median (green solid line) and the warmest (red dotted line); normalisation is the same as per Fig. 4. The corresponding observations are plotted in grey behind the models. Larger symbols indicate larger average grain size, and smaller symbols indicate smaller average grain size (see text for details).
Current usage metrics show cumulative count of Article Views (full-text article views including HTML views, PDF and ePub downloads, according to the available data) and Abstracts Views on Vision4Press platform.
Data correspond to usage on the plateform after 2015. The current usage metrics is available 48-96 hours after online publication and is updated daily on week days.
Initial download of the metrics may take a while.