Fig. A.1
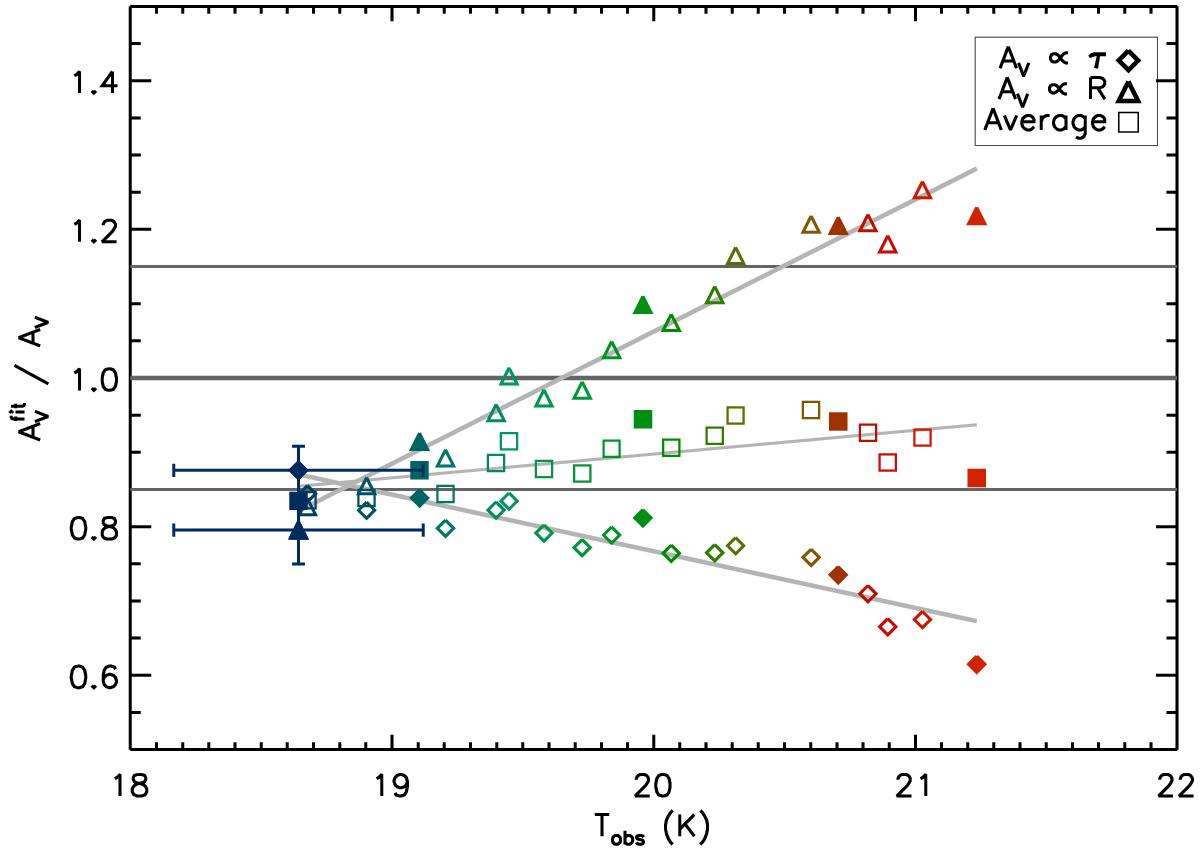
Scatter plot of ![]() and fitted dust temperature for the modified black-body fit. Two alternative estimates of AV are shown (see text), plus an average value. The horizontal grey lines show
and fitted dust temperature for the modified black-body fit. Two alternative estimates of AV are shown (see text), plus an average value. The horizontal grey lines show ![]() and the 15% uncertainty in the AV normalisation (Sect. 2.1). All points have similar relative uncertainty; the bars for the lowest Umin are shown. The uncertainties are systematic, so they affect each point in the same way; errors on the two axes are strongly anti-correlated. The Umin colour scheme is the same as Fig. 2; the filled symbols correspond to the SEDs shown in Fig. 1.
and the 15% uncertainty in the AV normalisation (Sect. 2.1). All points have similar relative uncertainty; the bars for the lowest Umin are shown. The uncertainties are systematic, so they affect each point in the same way; errors on the two axes are strongly anti-correlated. The Umin colour scheme is the same as Fig. 2; the filled symbols correspond to the SEDs shown in Fig. 1.
Current usage metrics show cumulative count of Article Views (full-text article views including HTML views, PDF and ePub downloads, according to the available data) and Abstracts Views on Vision4Press platform.
Data correspond to usage on the plateform after 2015. The current usage metrics is available 48-96 hours after online publication and is updated daily on week days.
Initial download of the metrics may take a while.