Fig. 5
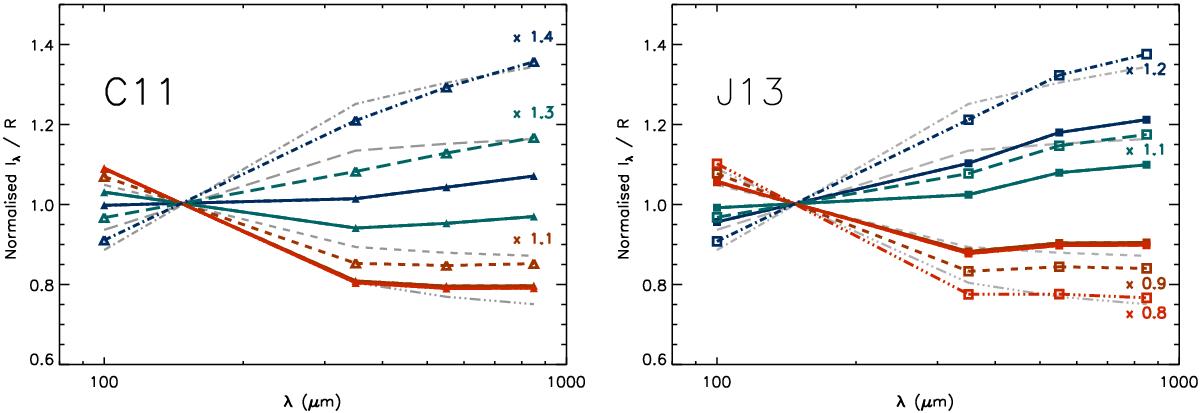
Effect of variable far-infrared opacity on Iλ/ ℛ for the C11 (left) and J13 (right) models. The same five SEDs as Fig. 1 are shown, except the median SED, using the same colour and line style scheme. The normalisation is the same as Fig. 4. The observations are plotted in grey behind the models; the standard dust models are the solid lines with filled polygonal symbols and the modified dust models are the dashed lines with empty symbols. Numbers show the multiplicative factor of far-infrared opacity.
Current usage metrics show cumulative count of Article Views (full-text article views including HTML views, PDF and ePub downloads, according to the available data) and Abstracts Views on Vision4Press platform.
Data correspond to usage on the plateform after 2015. The current usage metrics is available 48-96 hours after online publication and is updated daily on week days.
Initial download of the metrics may take a while.