Fig. 3
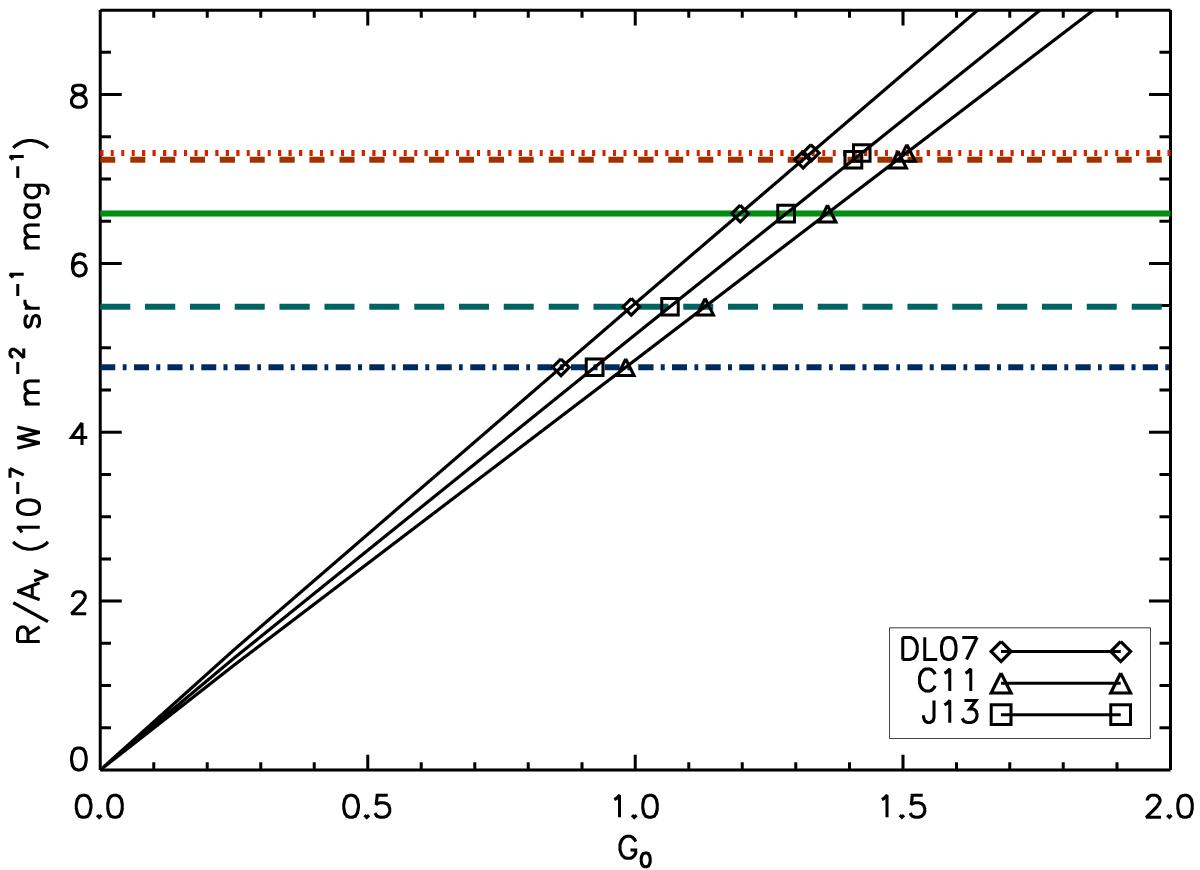
Estimation of G0 from the interpolation of ℛ /AV. The horizontal lines are the value of ℛ /AV for the observed SEDs, the curves from the origin are the ![]() . The abscissae of the intersection points are the estimates for G0 for that SED and model. The same 5 SEDs as Fig. 1 are shown, for clarity of illustration, using the same colour and line style scheme.
. The abscissae of the intersection points are the estimates for G0 for that SED and model. The same 5 SEDs as Fig. 1 are shown, for clarity of illustration, using the same colour and line style scheme.
Current usage metrics show cumulative count of Article Views (full-text article views including HTML views, PDF and ePub downloads, according to the available data) and Abstracts Views on Vision4Press platform.
Data correspond to usage on the plateform after 2015. The current usage metrics is available 48-96 hours after online publication and is updated daily on week days.
Initial download of the metrics may take a while.