Fig. 2
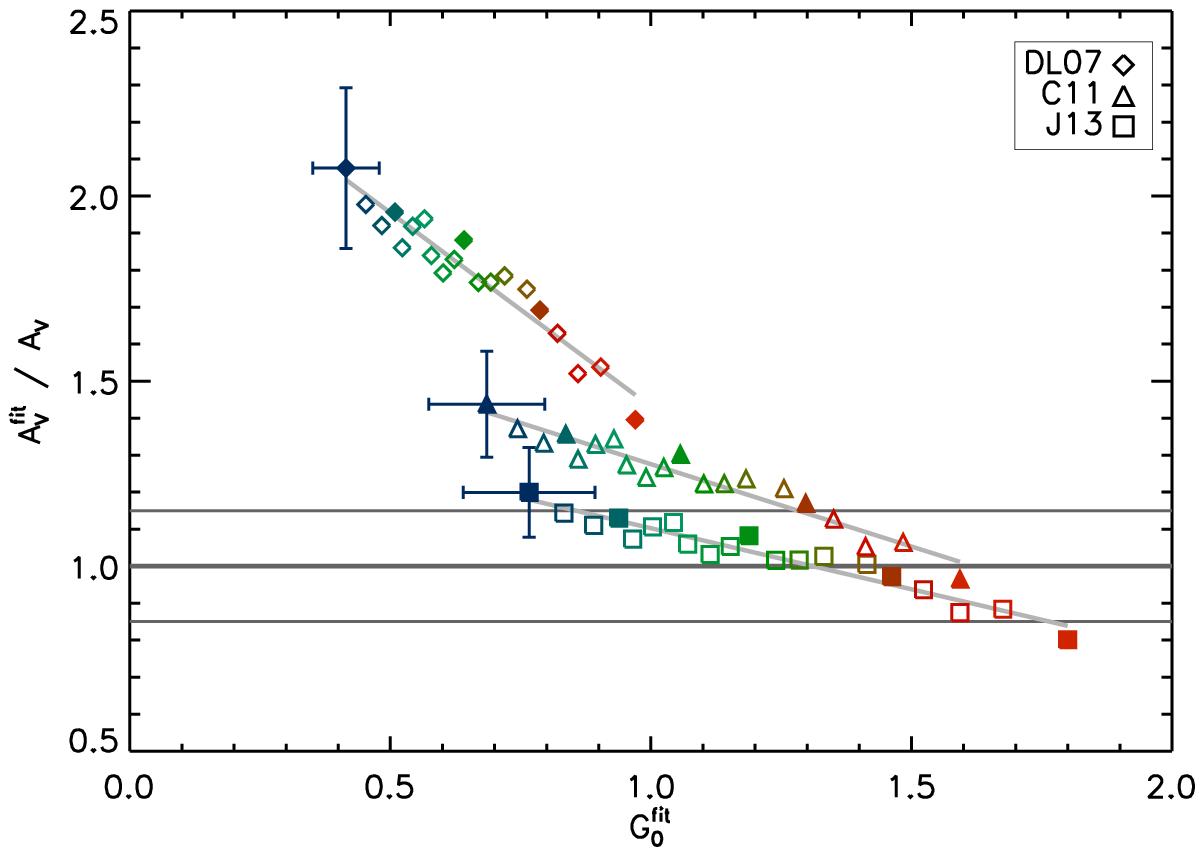
Fitted parameters ![]() and
and ![]() , for the three models. The colour scale goes from blue (cold) to red (warm). The filled symbols correspond to the SEDs shown in Fig. 1. All points have similar relative uncertainty; the error bars for the lowest Umin are shown. The uncertainties are systematic, so they affect each point in the same way; errors on the two axes are strongly anti-correlated (see Sect. 3.1). The horizontal grey lines show
, for the three models. The colour scale goes from blue (cold) to red (warm). The filled symbols correspond to the SEDs shown in Fig. 1. All points have similar relative uncertainty; the error bars for the lowest Umin are shown. The uncertainties are systematic, so they affect each point in the same way; errors on the two axes are strongly anti-correlated (see Sect. 3.1). The horizontal grey lines show ![]() and the 15% uncertainty in the AV normalisation (Sect. 2.1). The slanted grey lines are the least-square fits for each model; they were added to more easily tell apart the three models.
and the 15% uncertainty in the AV normalisation (Sect. 2.1). The slanted grey lines are the least-square fits for each model; they were added to more easily tell apart the three models.
Current usage metrics show cumulative count of Article Views (full-text article views including HTML views, PDF and ePub downloads, according to the available data) and Abstracts Views on Vision4Press platform.
Data correspond to usage on the plateform after 2015. The current usage metrics is available 48-96 hours after online publication and is updated daily on week days.
Initial download of the metrics may take a while.