Fig. 1
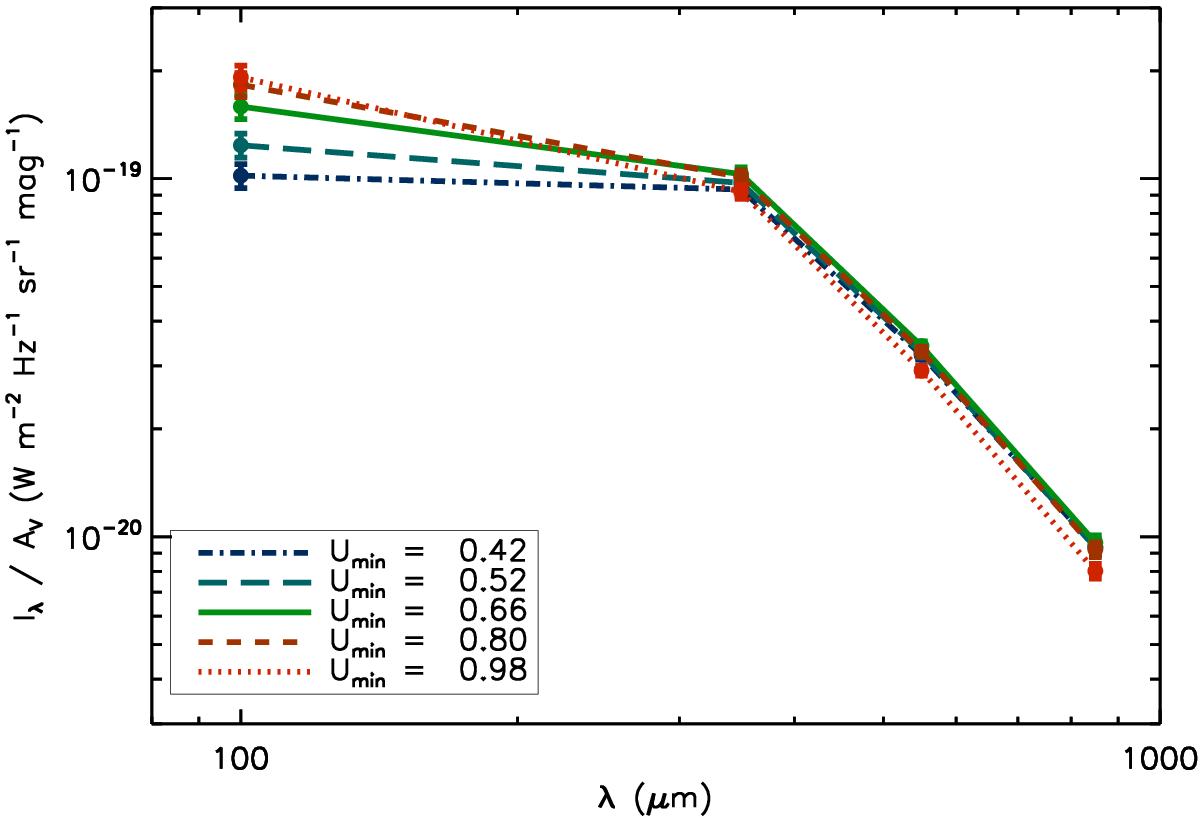
Subset from the 20 AV-normalised dust SEDs in Planck Collaboration Int. XXIX (2014). Each Umin, i.e. each temperature, is shown in a different colour and line style. For clarity of illustration, only five of the 20 SEDs are shown: the warmest and coldest overall SEDs, the warmest and coldest of the SEDs that are within a standard deviation from the average Umin, and the median SED. Symbols indicate the central band wavelengths; error bars indicate the dispersion for each band flux, while instrumental noise is negligible.
Current usage metrics show cumulative count of Article Views (full-text article views including HTML views, PDF and ePub downloads, according to the available data) and Abstracts Views on Vision4Press platform.
Data correspond to usage on the plateform after 2015. The current usage metrics is available 48-96 hours after online publication and is updated daily on week days.
Initial download of the metrics may take a while.