Fig. A.1
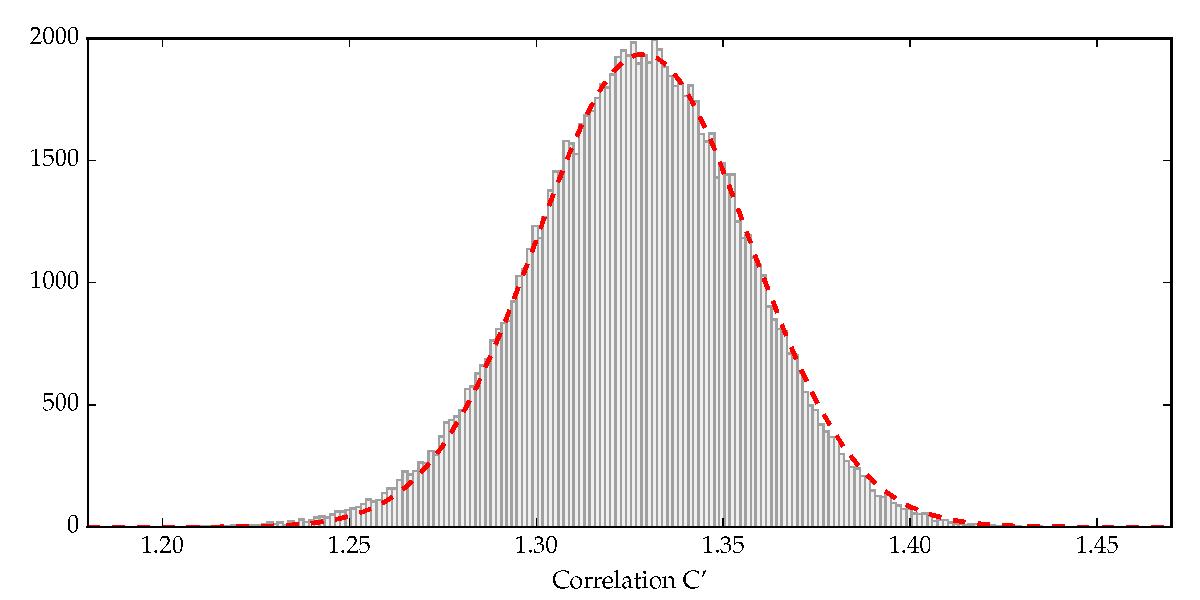
Histogram of the Monte Carlo-generated set of 105 Pearson correlation coefficients { C′ }. The red line shows the Gaussian fit. The C′ values were transformed with the Fisher transformation. The reverse Fisher transformation of the fit gives a Pearson correlation coefficient equal to 0.87, and its error is estimated to 0.03.
Current usage metrics show cumulative count of Article Views (full-text article views including HTML views, PDF and ePub downloads, according to the available data) and Abstracts Views on Vision4Press platform.
Data correspond to usage on the plateform after 2015. The current usage metrics is available 48-96 hours after online publication and is updated daily on week days.
Initial download of the metrics may take a while.