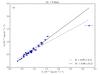
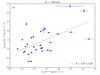
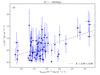
Fig. 6
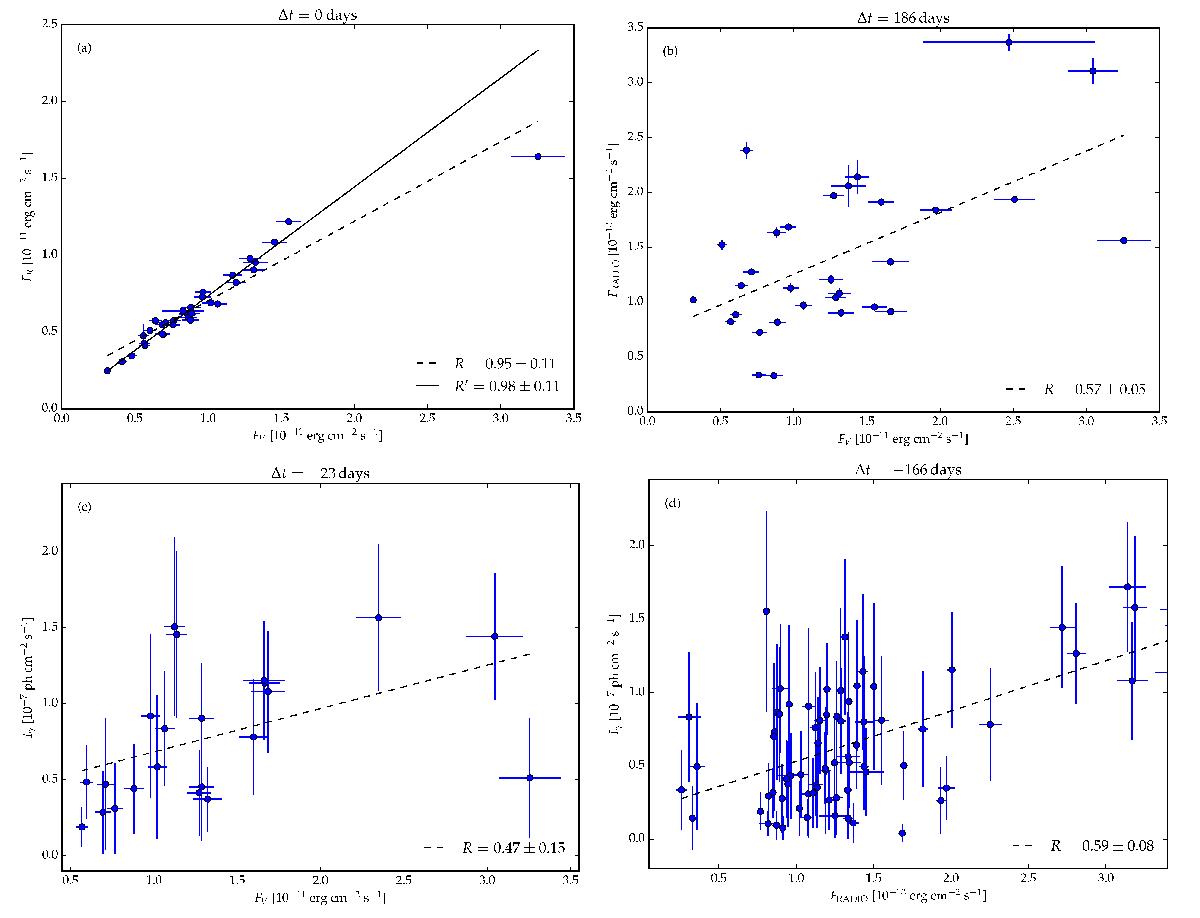
Subplot a) shows the comparison of the optical flux in R (FR) and V (FV) band for PKS 0048−097 for simultaneous observations. The Pearson correlation coefficients for the two cases of a full set of data – solid line and without one data point (in right upper corner in the plot) – dashed line, are provided in the lower right corner. The following subplots show the relation for shifted light curves for b) the radio flux, FRADIO vs. FV; c) integrated gamma-ray flux, Iγ vs. FV; and d) Iγ vs. FRADIO. The light curves are shifted by Δt according to τmax shown in Table 4. In the lower right corner the Pearson correlation coefficients are provided.
Current usage metrics show cumulative count of Article Views (full-text article views including HTML views, PDF and ePub downloads, according to the available data) and Abstracts Views on Vision4Press platform.
Data correspond to usage on the plateform after 2015. The current usage metrics is available 48-96 hours after online publication and is updated daily on week days.
Initial download of the metrics may take a while.