Fig. 5
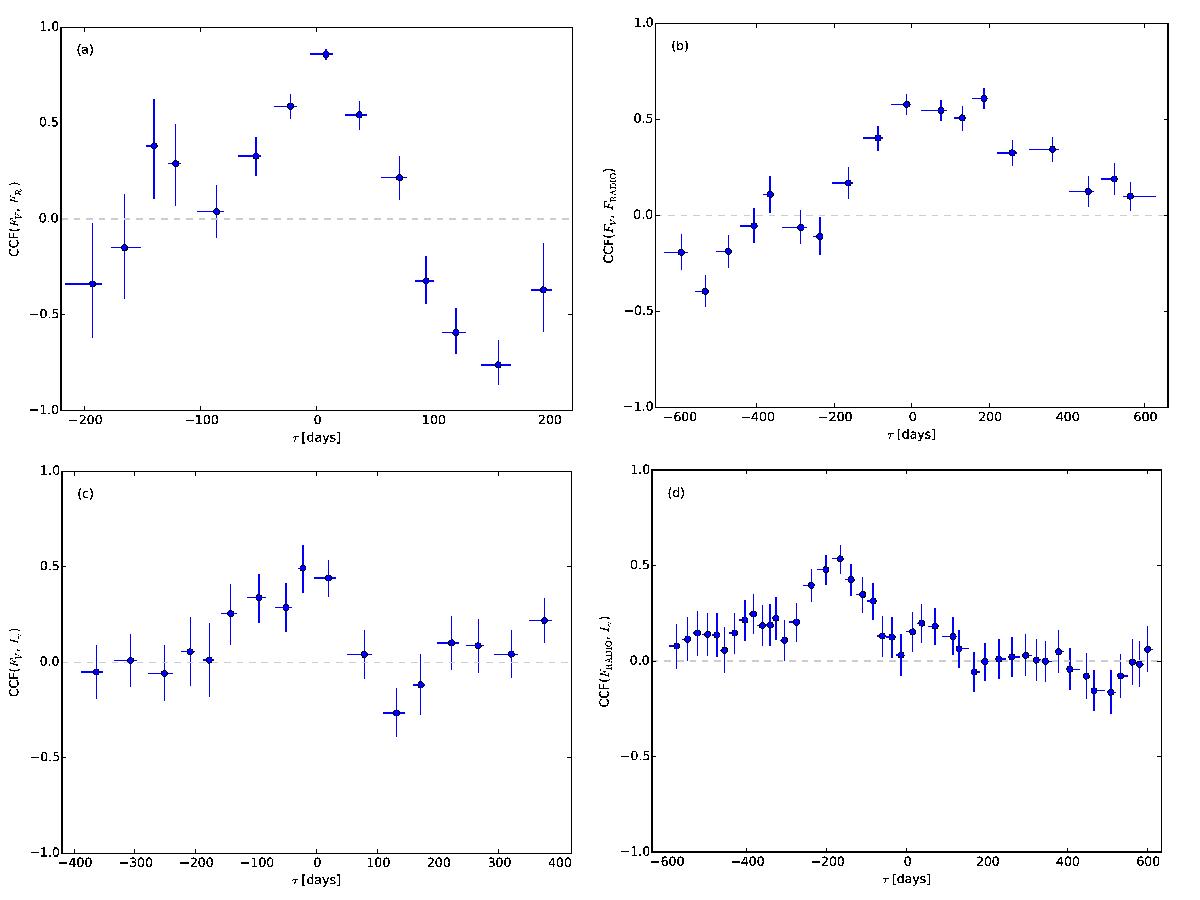
Estimate of the cross-correlation function for different time lags for long-term light curve of PKS 0048−097 (see Fig. 1). All data are binned in weekly averaged intervals. The following subplots show the CCF for a) optical flux in V band, FV versus optical flux in R band, FR as a function of time delay; b) optical flux in V band, FV versus radio flux FRADIO as a function of time delay; c) optical flux in V band, FV versus γ-ray integrated flux Iγ as a function of time delay; d) radio flux, FRADIO versus γ-ray integrated flux, Iγ as a function of time delay.
Current usage metrics show cumulative count of Article Views (full-text article views including HTML views, PDF and ePub downloads, according to the available data) and Abstracts Views on Vision4Press platform.
Data correspond to usage on the plateform after 2015. The current usage metrics is available 48-96 hours after online publication and is updated daily on week days.
Initial download of the metrics may take a while.