Fig. 2
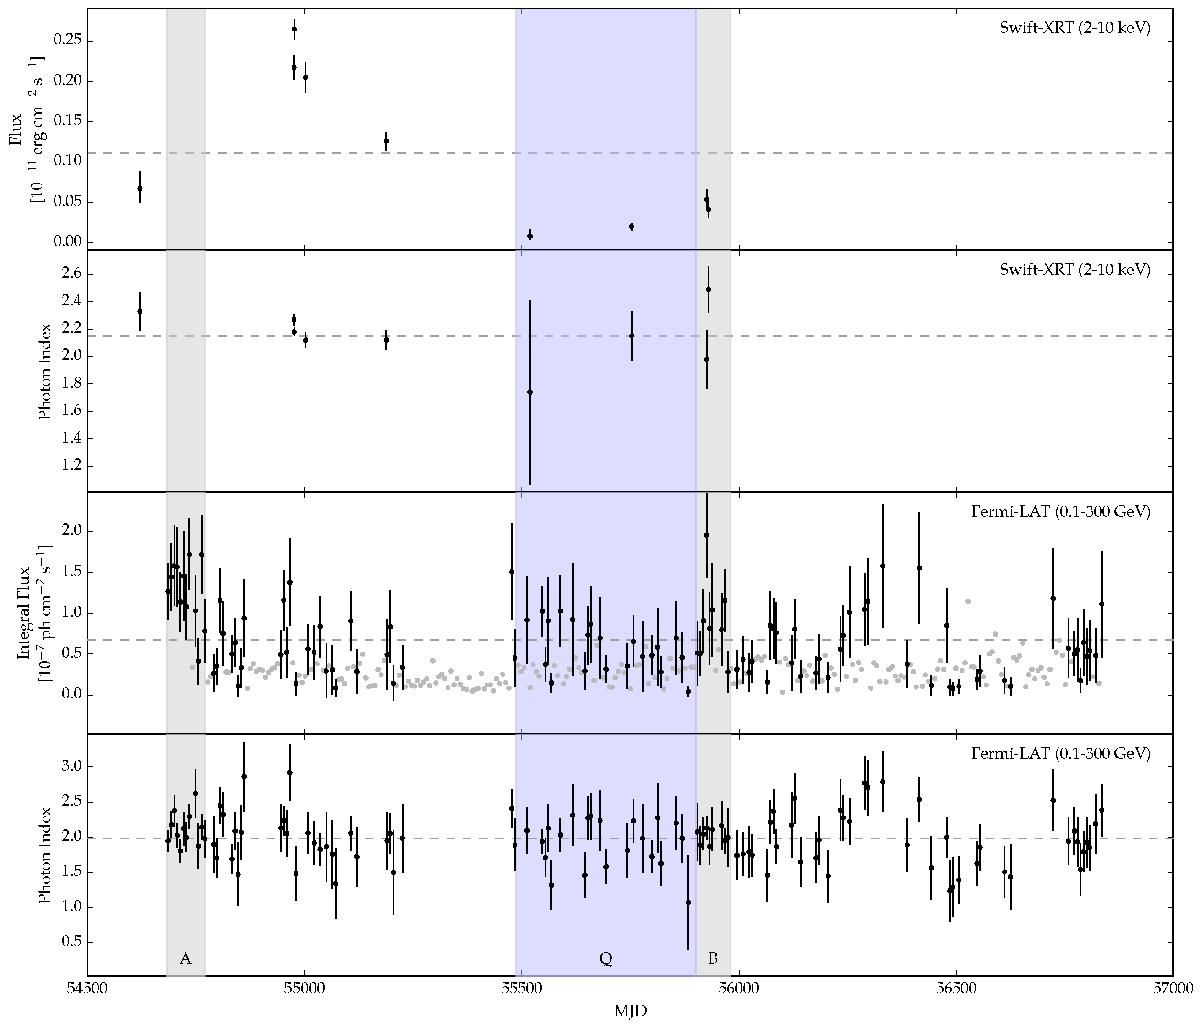
Temporal and spectral variability of PKS 0048−097 observed with Swift/XRT and Fermi/LAT. The following panels present the X-ray temporal and spectral variability and the γ-ray temporal and spectral variability. For Swift/XRT observations one point correspond to one day of observations, while in the case of Fermi/LAT data one point is for weekly integrated observations. We plot the flux upper limits in the Fermi/LAT light curve with grey points. The time periods corresponding to A and B flares are marked in grey, while the quiescence period Q is shown in blue.
Current usage metrics show cumulative count of Article Views (full-text article views including HTML views, PDF and ePub downloads, according to the available data) and Abstracts Views on Vision4Press platform.
Data correspond to usage on the plateform after 2015. The current usage metrics is available 48-96 hours after online publication and is updated daily on week days.
Initial download of the metrics may take a while.