Fig. 1
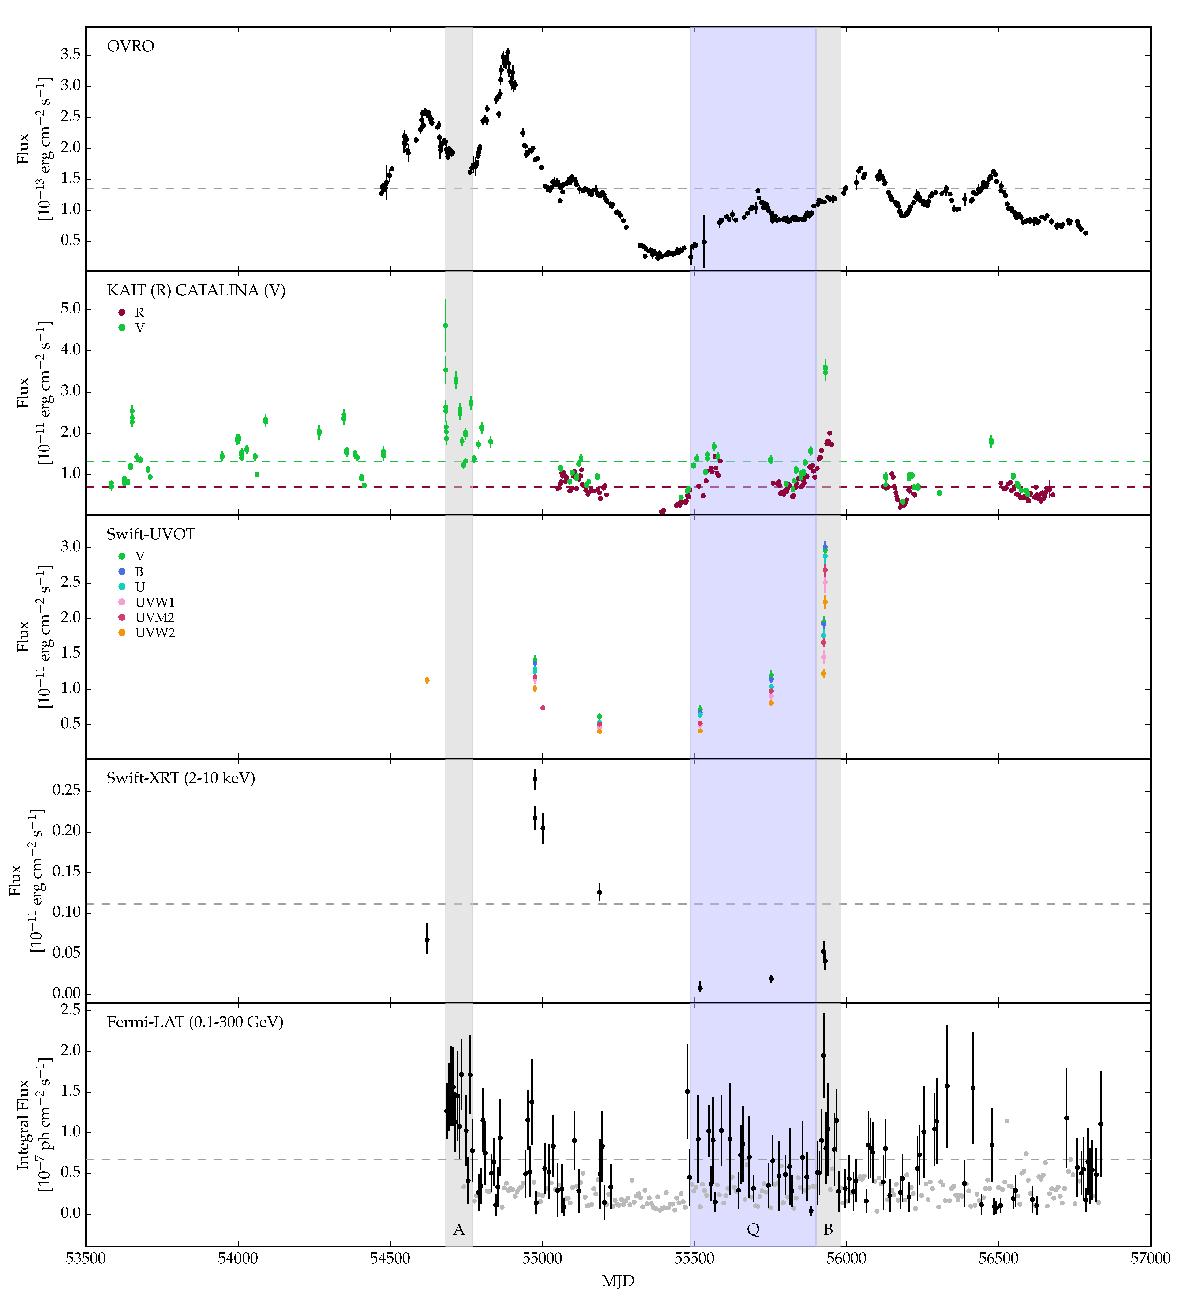
Multi-wavelength light curve of PKS 0048−097. Panels from the top to the bottom show the radio observations from the OVRO telescope at 15 GHz; optical (KAIT and Catalina) monitoring in R and V band, Swift/UVOT data in V, B, U, UVW1, UVM2, and UVW2 filters, X-ray observations with Swift/XRT, and Fermi/LAT flux (E> 100 MeV). The horizontal dashed lines in all the panels represent the average flux for all observations presented here. In all the cases (excluding Fermi/LAT data) each point corresponds to one night of observations; for the case of Fermi/LAT monitoring data are binned in week-long intervals. In the Fermi/LAT light curve, flux upper limits are represented with grey points. The time periods corresponding to A and B flares are marked in grey, while the quiescence period Q is plotted in blue.
Current usage metrics show cumulative count of Article Views (full-text article views including HTML views, PDF and ePub downloads, according to the available data) and Abstracts Views on Vision4Press platform.
Data correspond to usage on the plateform after 2015. The current usage metrics is available 48-96 hours after online publication and is updated daily on week days.
Initial download of the metrics may take a while.