Fig. 4
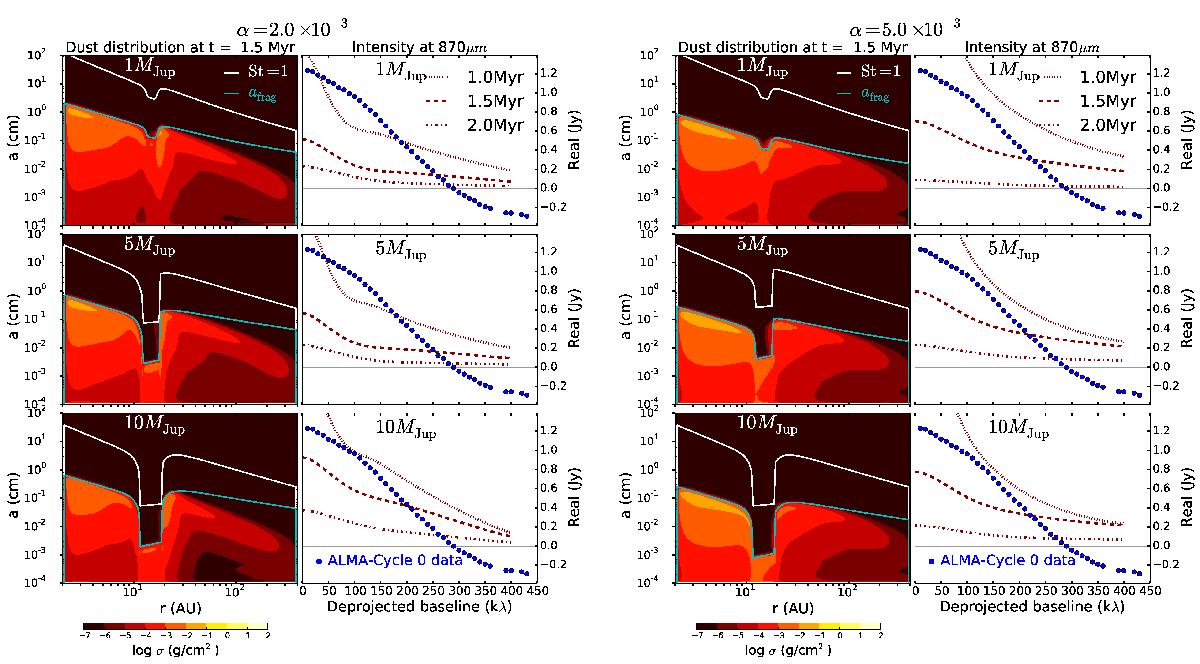
Dust density distribution after 1.5 Myr of evolution and real part of the visibilities at 870 μm at different times of dust evolution, when a single planet interacts with the disk for two different values of disk viscosity, α = 2 × 10⁻³ (left column) and α = 5 × 10⁻³ (right column). From top to bottom, the masses of the planet are: 1, 5, and 10 MJup. ALMA Cycle 0 data are over-plotted in Fig. 3. In the dust density distribution plots, the white and blue lines correspond to St = 1 (Eq. (3)), and afrag (Eq. (9)) respectively.
Current usage metrics show cumulative count of Article Views (full-text article views including HTML views, PDF and ePub downloads, according to the available data) and Abstracts Views on Vision4Press platform.
Data correspond to usage on the plateform after 2015. The current usage metrics is available 48-96 hours after online publication and is updated daily on week days.
Initial download of the metrics may take a while.