Fig. 3
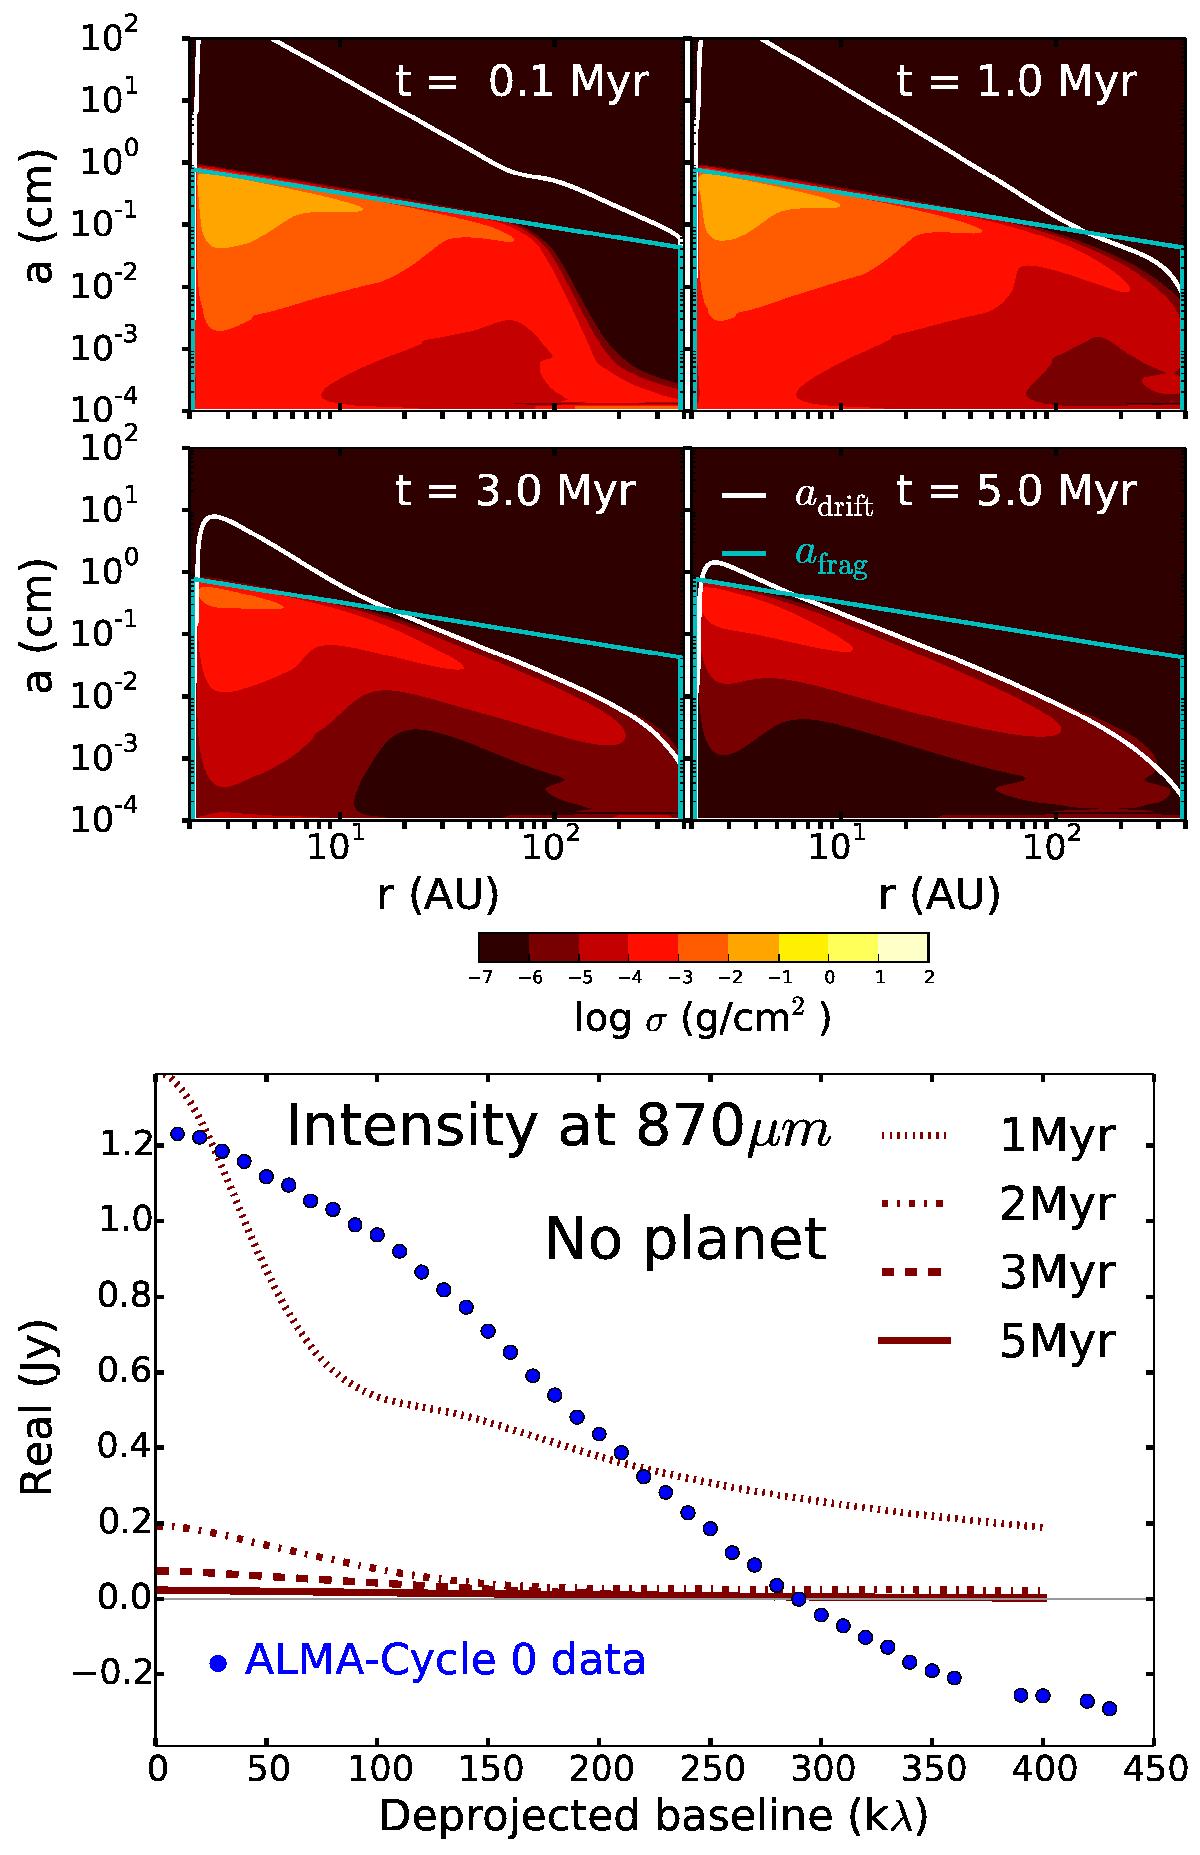
Dust density distribution at different times of evolution (upper panel) and real part of the visibilities at 870 μm (bottom panel) at different times of dust evolution, when no planet is embedded in the disk. ALMA Cycle 0 data at this wavelength are over-plotted (data from Walsh et al. 2014). In the upper panel, the white and blue line correspond to adrift (Eq. (10)), and afrag (Eq. (9)), respectively.
Current usage metrics show cumulative count of Article Views (full-text article views including HTML views, PDF and ePub downloads, according to the available data) and Abstracts Views on Vision4Press platform.
Data correspond to usage on the plateform after 2015. The current usage metrics is available 48-96 hours after online publication and is updated daily on week days.
Initial download of the metrics may take a while.