Fig. 4
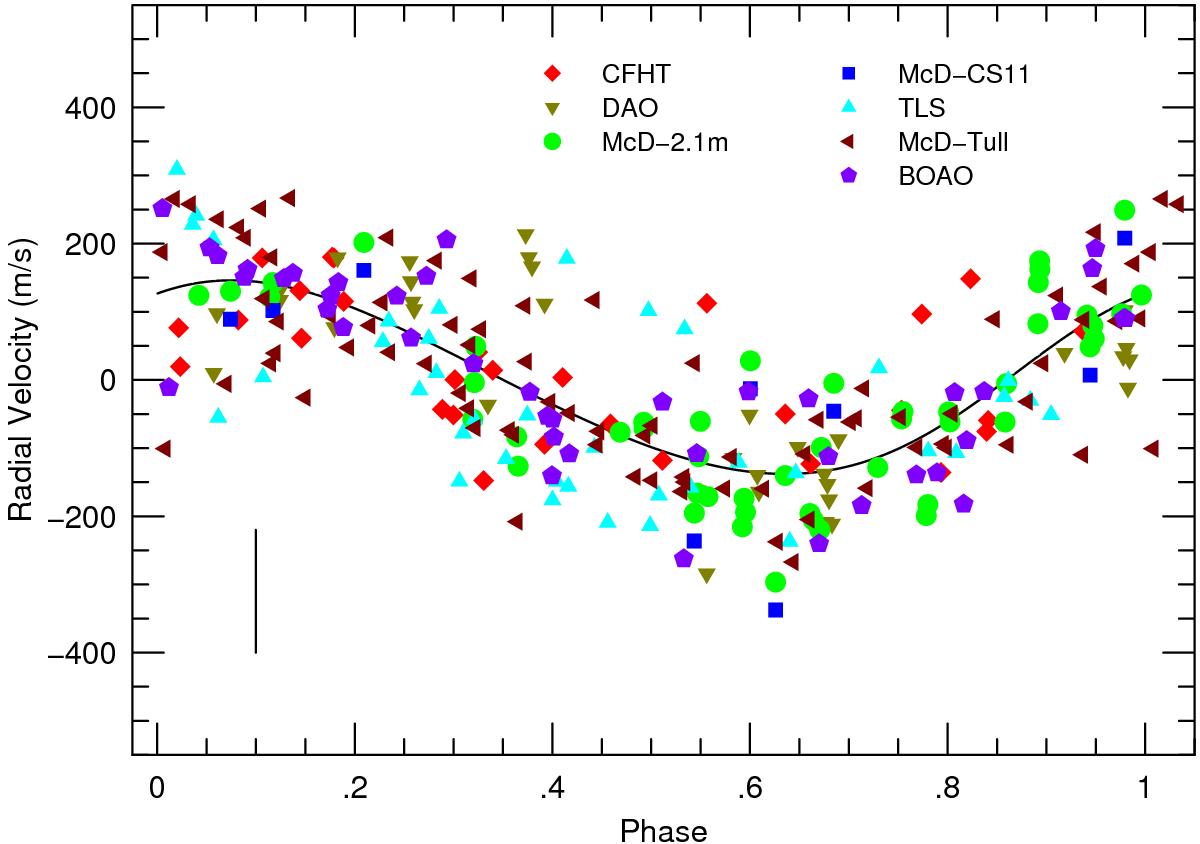
Radial velocity measurements for α Tau from the seven data sets phased to the orbital period.For the TLS and McD-Tull data we plot run-binned averages that were used in the orbital solution. The solid line is the orbital solution and the vertical line the peak-peak short term intrinsic RV variations observed for this star. Symbols are the same as for Fig. 2. Error bars for individual measurements are not shown for clarity and because the scatter is dominated by the intrinsic stellar variability.
Current usage metrics show cumulative count of Article Views (full-text article views including HTML views, PDF and ePub downloads, according to the available data) and Abstracts Views on Vision4Press platform.
Data correspond to usage on the plateform after 2015. The current usage metrics is available 48-96 hours after online publication and is updated daily on week days.
Initial download of the metrics may take a while.