Fig. 3
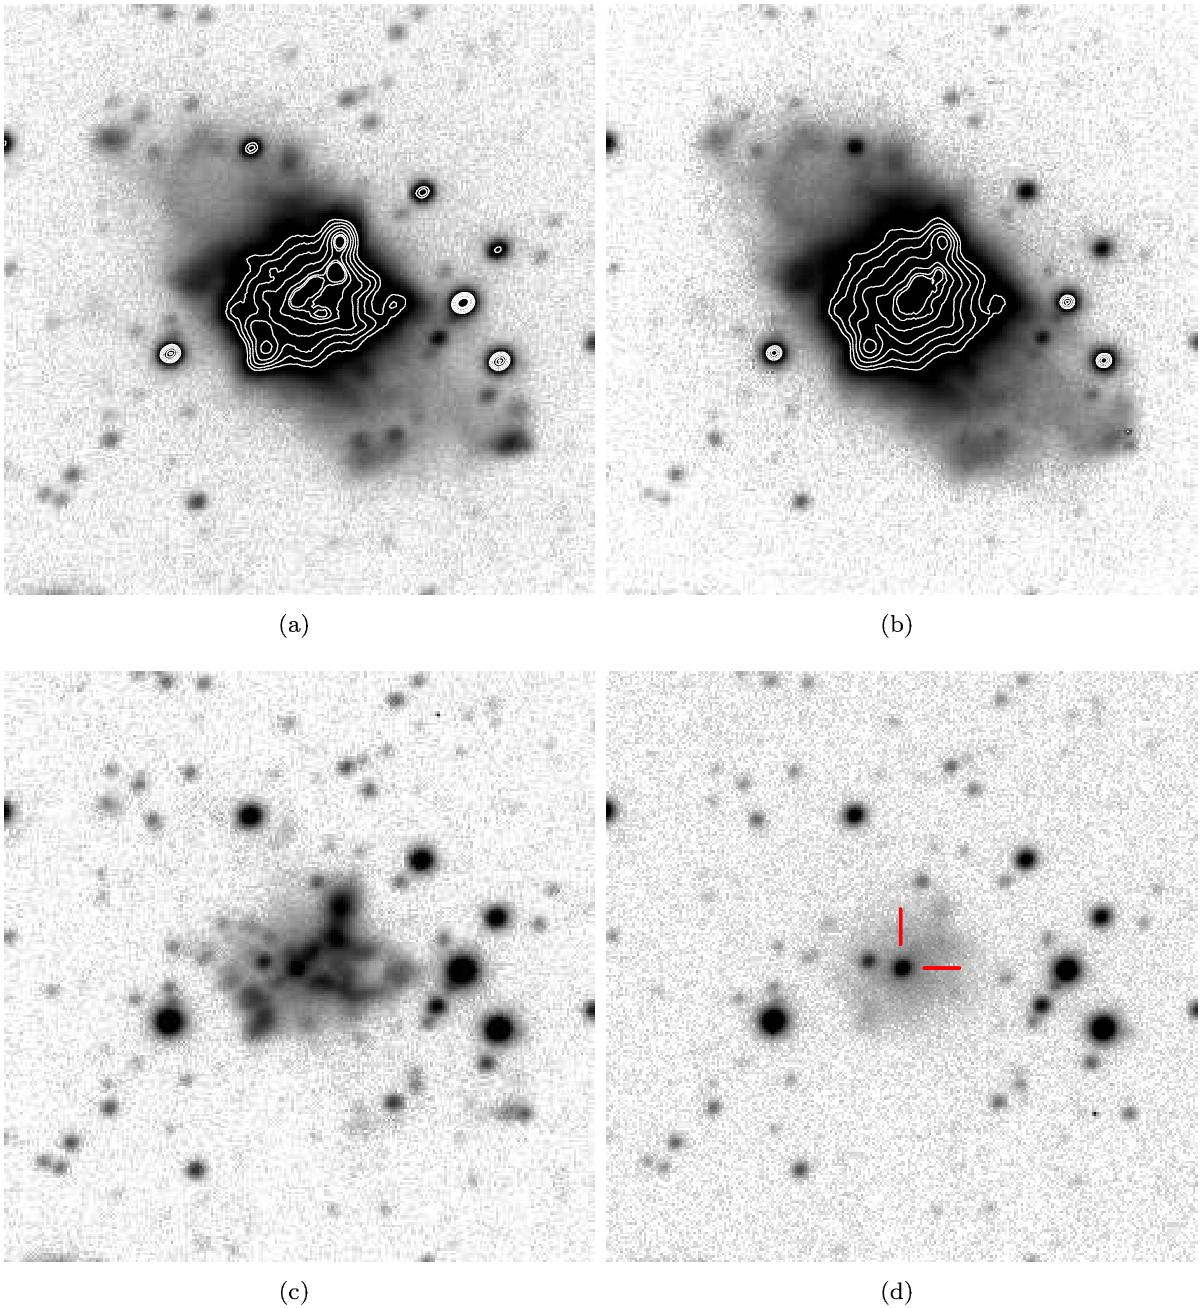
NTT-EFOSC2 images of Hen 2-155 in the light of a) Hα+[N ii]; b) [O iii] λ5007 Å; c) [S ii] λ6716+6731 Å and d) Hβ-continuum (with central star highlighted). North is up, east to the left and each image measures 1′× 1′. All images are displayed on a logarithmic scale. The contours in a) and b) represent the 99.7, 99.5, 99, 98, 97, 96 and 95th percentiles and highlight the brighter central structures visible in each filter.
Current usage metrics show cumulative count of Article Views (full-text article views including HTML views, PDF and ePub downloads, according to the available data) and Abstracts Views on Vision4Press platform.
Data correspond to usage on the plateform after 2015. The current usage metrics is available 48-96 hours after online publication and is updated daily on week days.
Initial download of the metrics may take a while.