Fig. 9
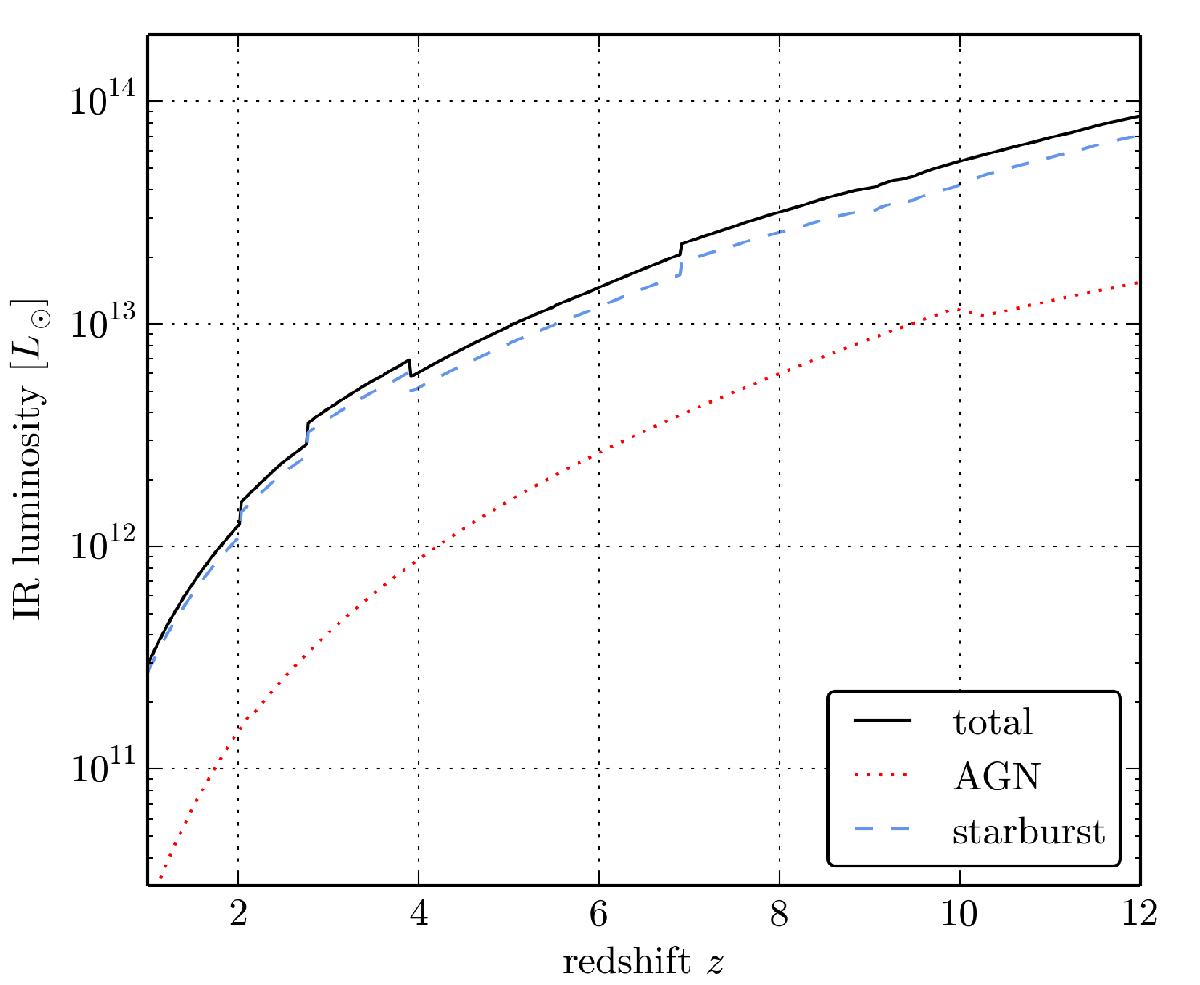
Maximum infrared luminosity versus redshift for the AGN (red dotted line) component, the SB (blue dashed line) component, and for the total IR luminosity (black solid line). The underlying model (see Fig. 8 for an example) matched the measured radio flux density of 15 mJy at 1.4 GHz. We note that the total IR luminosity and the SB IR luminosity are upper limits.
Current usage metrics show cumulative count of Article Views (full-text article views including HTML views, PDF and ePub downloads, according to the available data) and Abstracts Views on Vision4Press platform.
Data correspond to usage on the plateform after 2015. The current usage metrics is available 48-96 hours after online publication and is updated daily on week days.
Initial download of the metrics may take a while.