Fig. 8
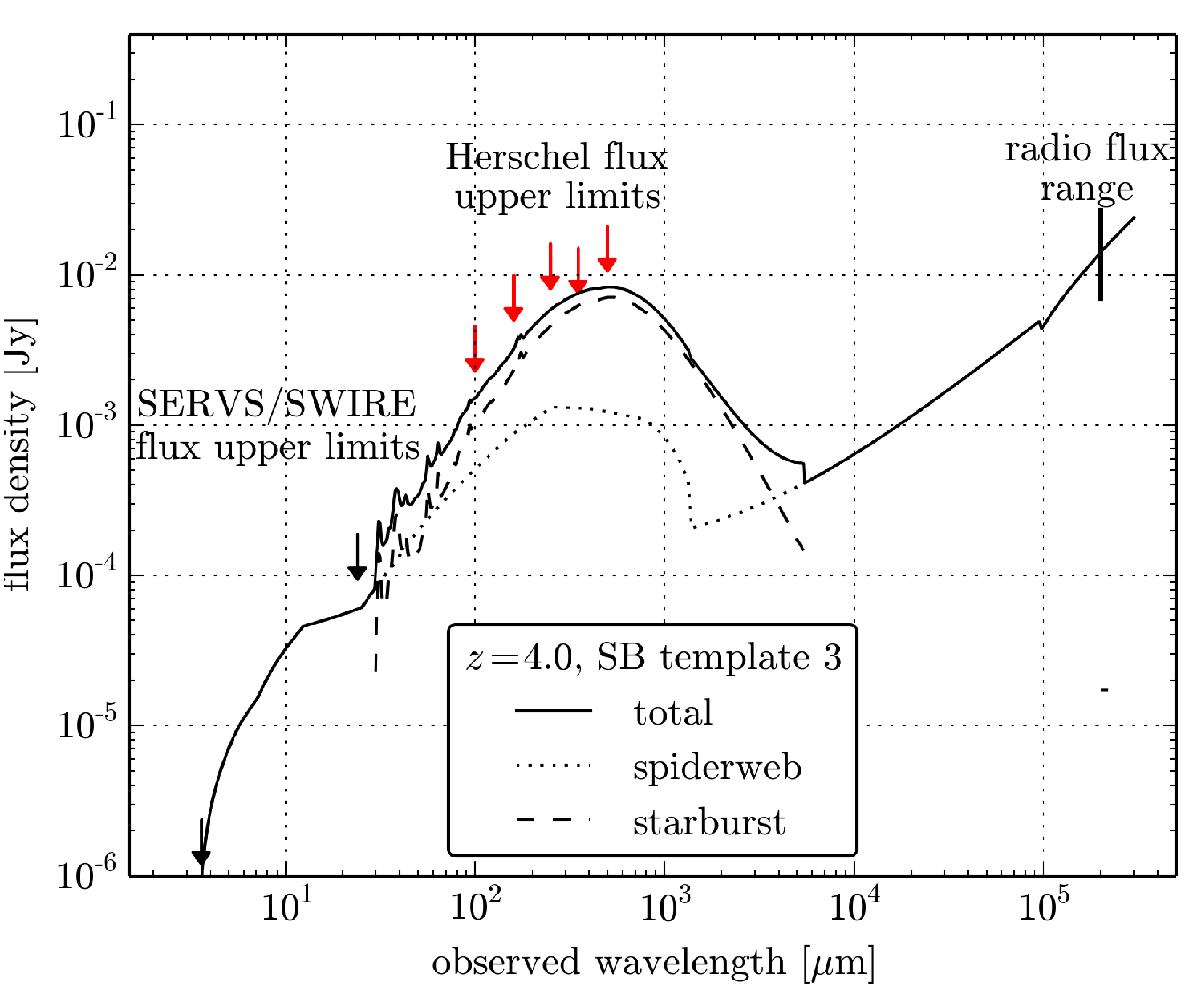
IR SED modelling for IFRS at redshift z = 4, using the FIR flux density upper limits (red arrows) measured in this work, the SERVS/SWIRE flux density upper limits (black arrows), and the measured radio flux density of 15 mJy at 1.4 GHz. The total (solid line) emission is composed of the scaled spiderweb galaxy template (dotted line) and one scaled SB component (dashed line). Note that the limited wavelength coverage of the SB template caused the leaps at 30 μm and 5450 μm. The fit represents an upper limit on the IR emission of IFRS and is defined by matching the radio flux density of 15 mJy at 1.4 GHz and providing the lowest deviation between all available flux density upper limits and the total SED. Note that the dash at 21 cm (flux density of ≈20 μJy) is the contribution of the additional SB component to the 1.4 GHz flux density.
Current usage metrics show cumulative count of Article Views (full-text article views including HTML views, PDF and ePub downloads, according to the available data) and Abstracts Views on Vision4Press platform.
Data correspond to usage on the plateform after 2015. The current usage metrics is available 48-96 hours after online publication and is updated daily on week days.
Initial download of the metrics may take a while.