Fig. 7
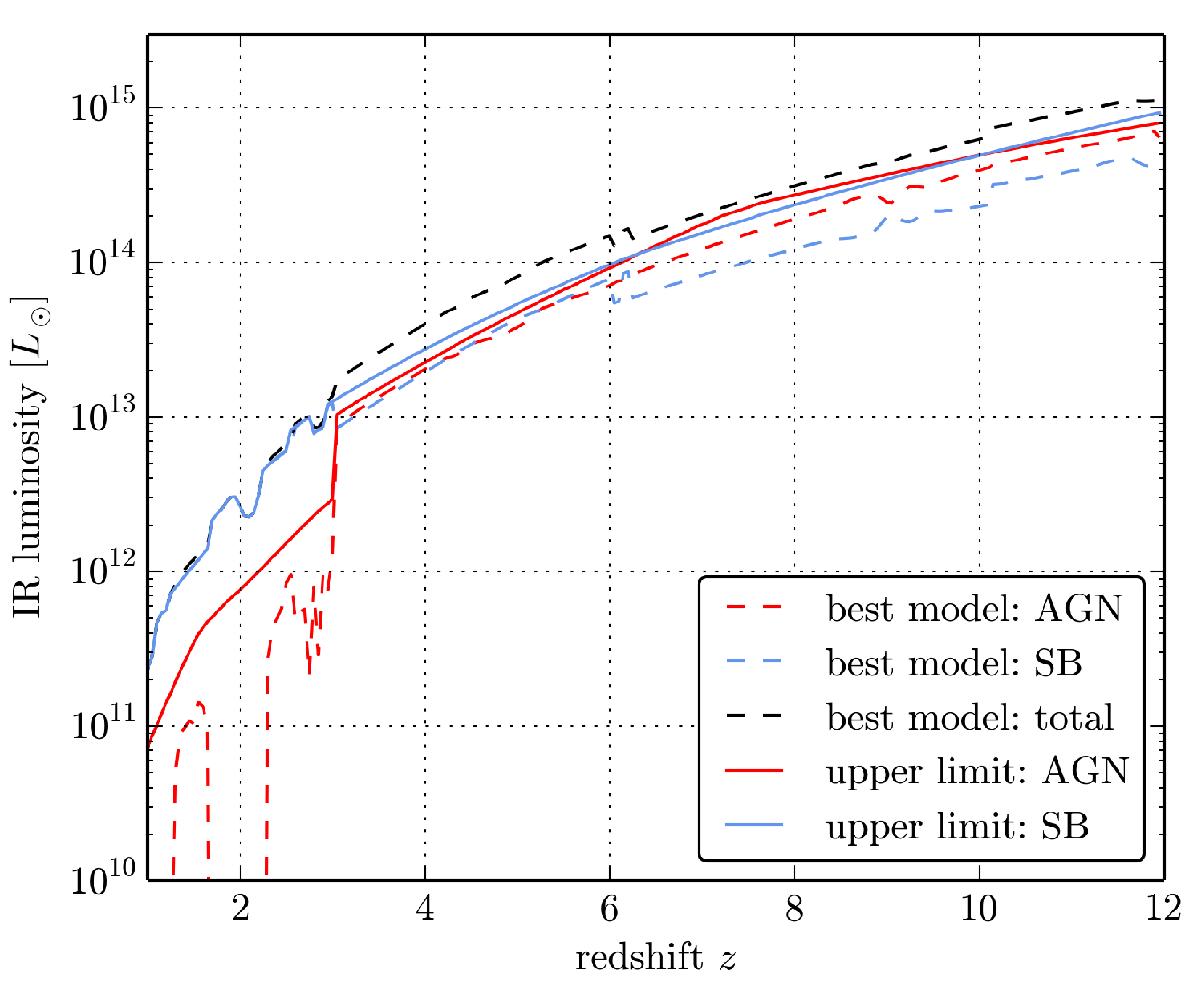
Infrared luminosity versus redshift for the SB (blue) and AGN (red) component as well as for the total IR luminosity (black). The dashed lines show the data of the maximum IR SED model, combining the AGN and the most appropriate SB template. The solid lines show the IR luminosity upper limits for both components, assuming that the other component does not contribute to the IR emission at each time.
Current usage metrics show cumulative count of Article Views (full-text article views including HTML views, PDF and ePub downloads, according to the available data) and Abstracts Views on Vision4Press platform.
Data correspond to usage on the plateform after 2015. The current usage metrics is available 48-96 hours after online publication and is updated daily on week days.
Initial download of the metrics may take a while.