Fig. 6
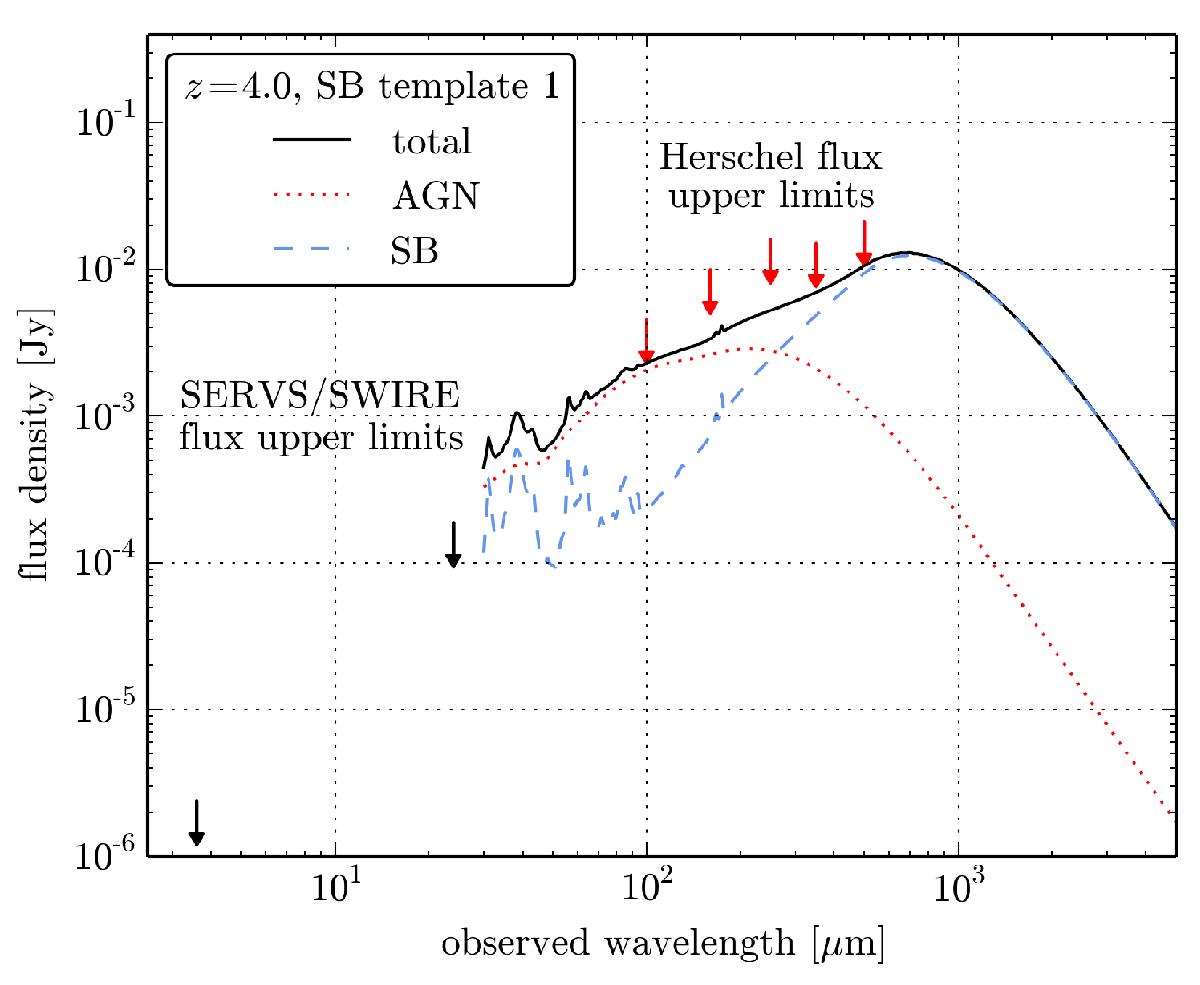
IR SED modelling for IFRS at redshift z = 4, using the FIR flux density upper limits (red arrows) measured in this work. The total (black solid line) IR emission is composed of an AGN component (red dotted line) and a SB component (blue dashed line). The maximum model represents an upper limit on the IR emission of IFRS and is defined by the highest IR flux which is in agreement with all available flux density upper limits.
Current usage metrics show cumulative count of Article Views (full-text article views including HTML views, PDF and ePub downloads, according to the available data) and Abstracts Views on Vision4Press platform.
Data correspond to usage on the plateform after 2015. The current usage metrics is available 48-96 hours after online publication and is updated daily on week days.
Initial download of the metrics may take a while.