Fig. 2
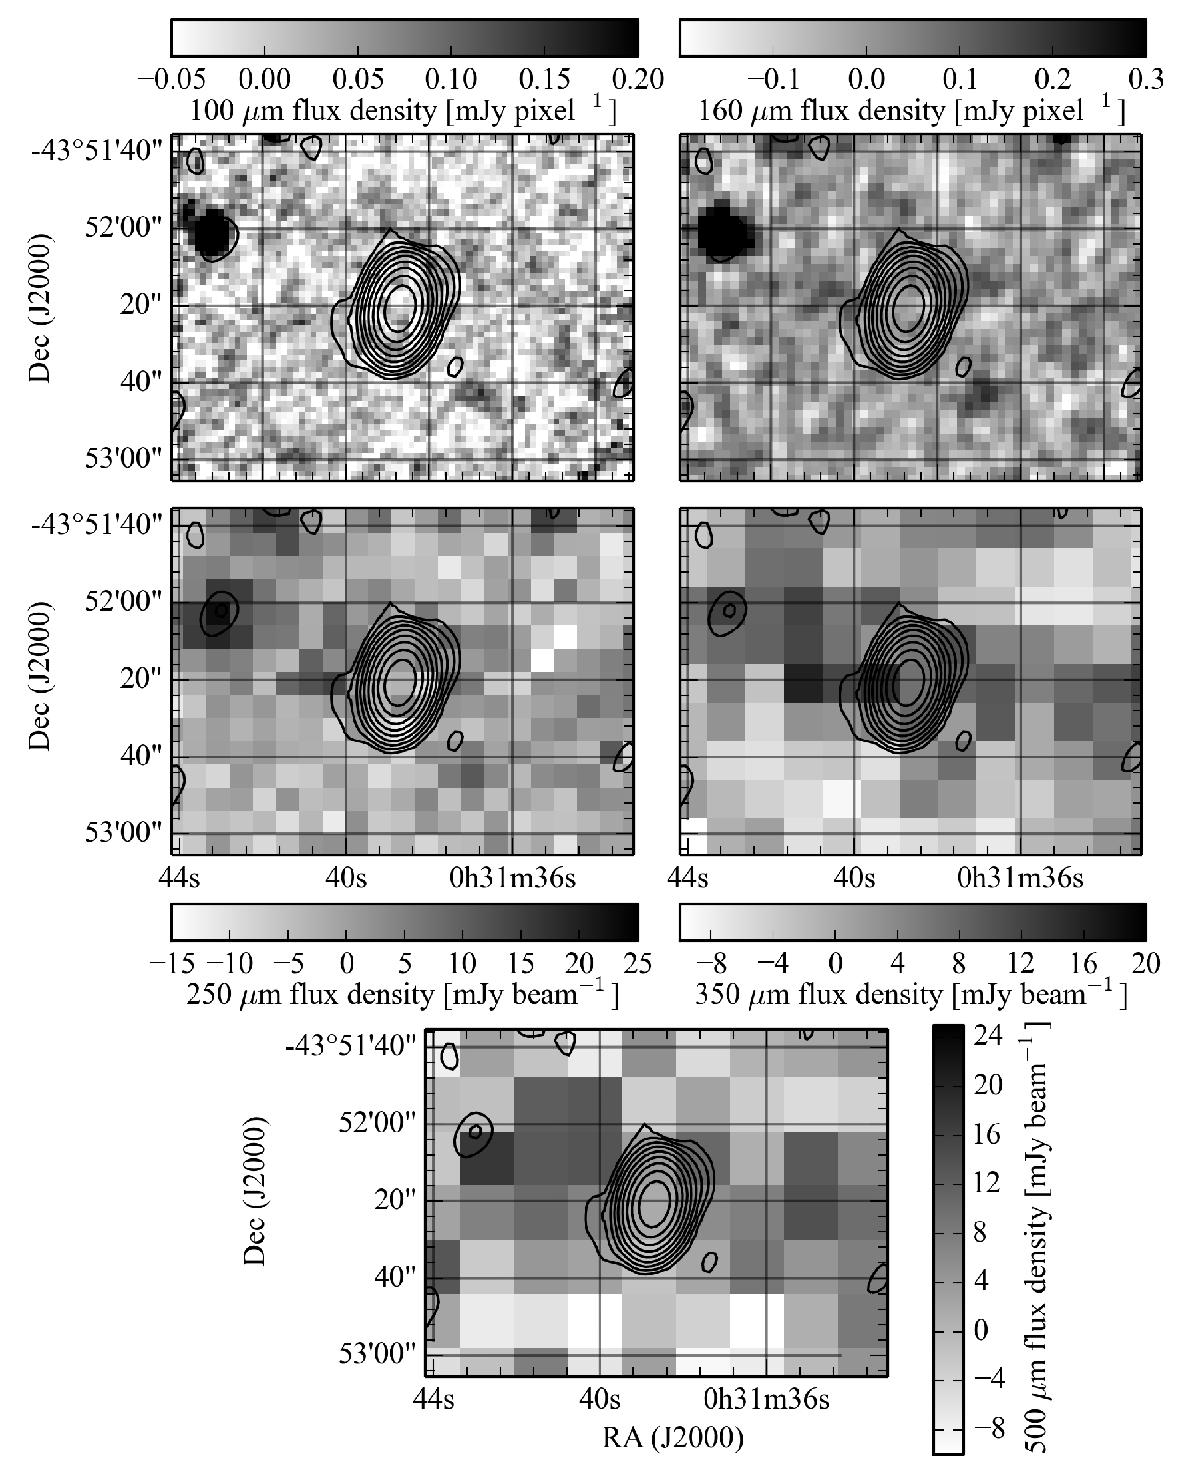
Final Herschel maps (greyscale) of IFRS S509 overlaid by the 1.4 GHz radio contours (ATLAS data release 3; σ ≈ 20 μJy beam-1; Franzen et al. 2015). Shown are the contours at 2σ, 4σ, 8σ, 16σ, etc. Top down and from left to right: 100 μm, 160 μm (both PACS), 250 μm, 350 μm, and 500 μm (SPIRE) maps. None of the five maps provides a detection of S509.
Current usage metrics show cumulative count of Article Views (full-text article views including HTML views, PDF and ePub downloads, according to the available data) and Abstracts Views on Vision4Press platform.
Data correspond to usage on the plateform after 2015. The current usage metrics is available 48-96 hours after online publication and is updated daily on week days.
Initial download of the metrics may take a while.