Fig. 10
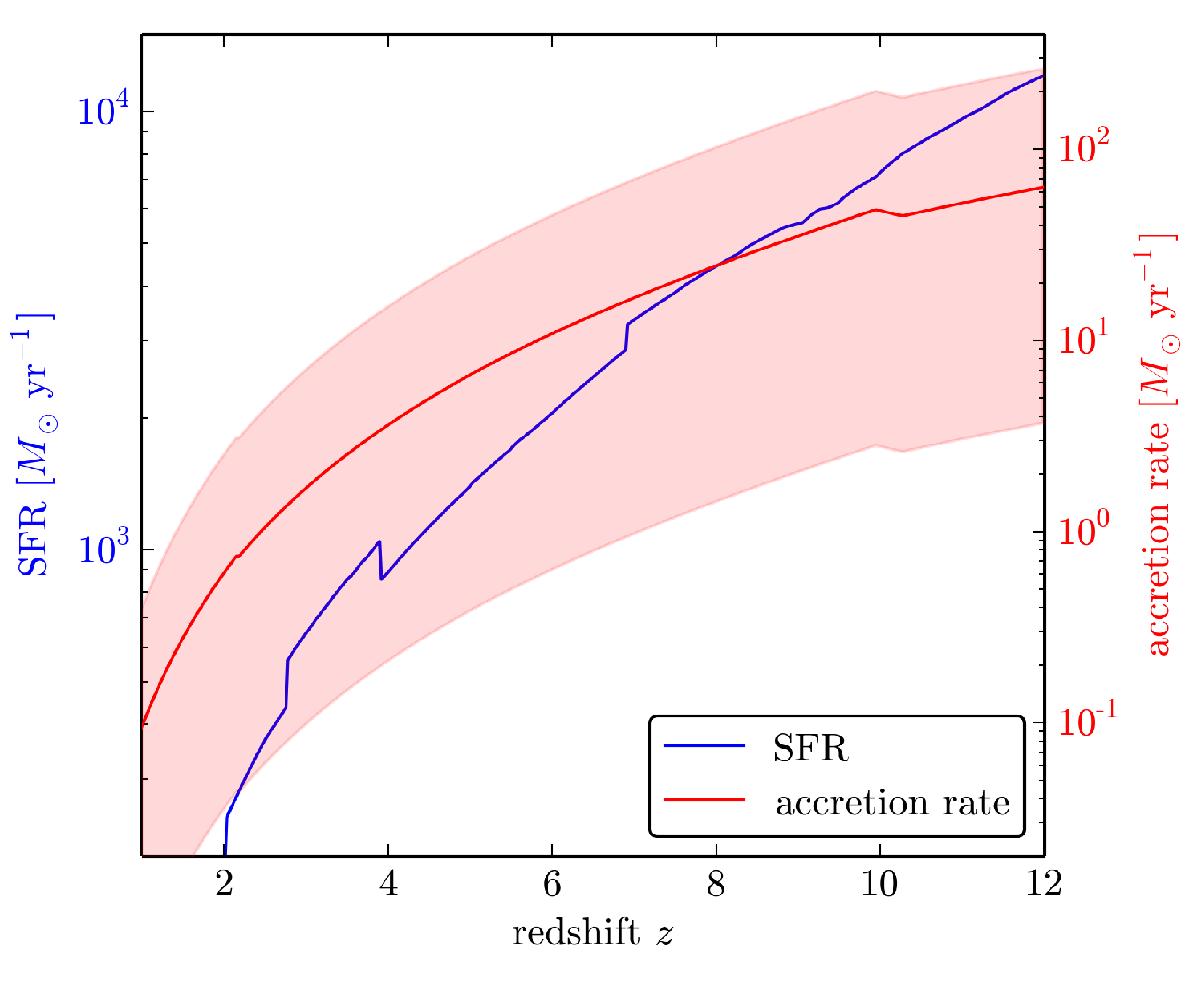
Star formation rate (blue line) and accretion rate (red line) versus redshift. The calculation of both rates is based on the modelling described in Sect. 5.2.2, matching the measured 1.4 GHz flux density of 15 mJy and providing the lowest deviation to all available flux density upper limits. The red shaded area represents the uncertainty in the determination of the BH accretion rate, based on varied numbers for the efficiency factor ϵ and the conversion factor κ. We note that the SFR is meant to be an upper limit since the SB contribution is only constrained by upper limits.
Current usage metrics show cumulative count of Article Views (full-text article views including HTML views, PDF and ePub downloads, according to the available data) and Abstracts Views on Vision4Press platform.
Data correspond to usage on the plateform after 2015. The current usage metrics is available 48-96 hours after online publication and is updated daily on week days.
Initial download of the metrics may take a while.