Fig. 5
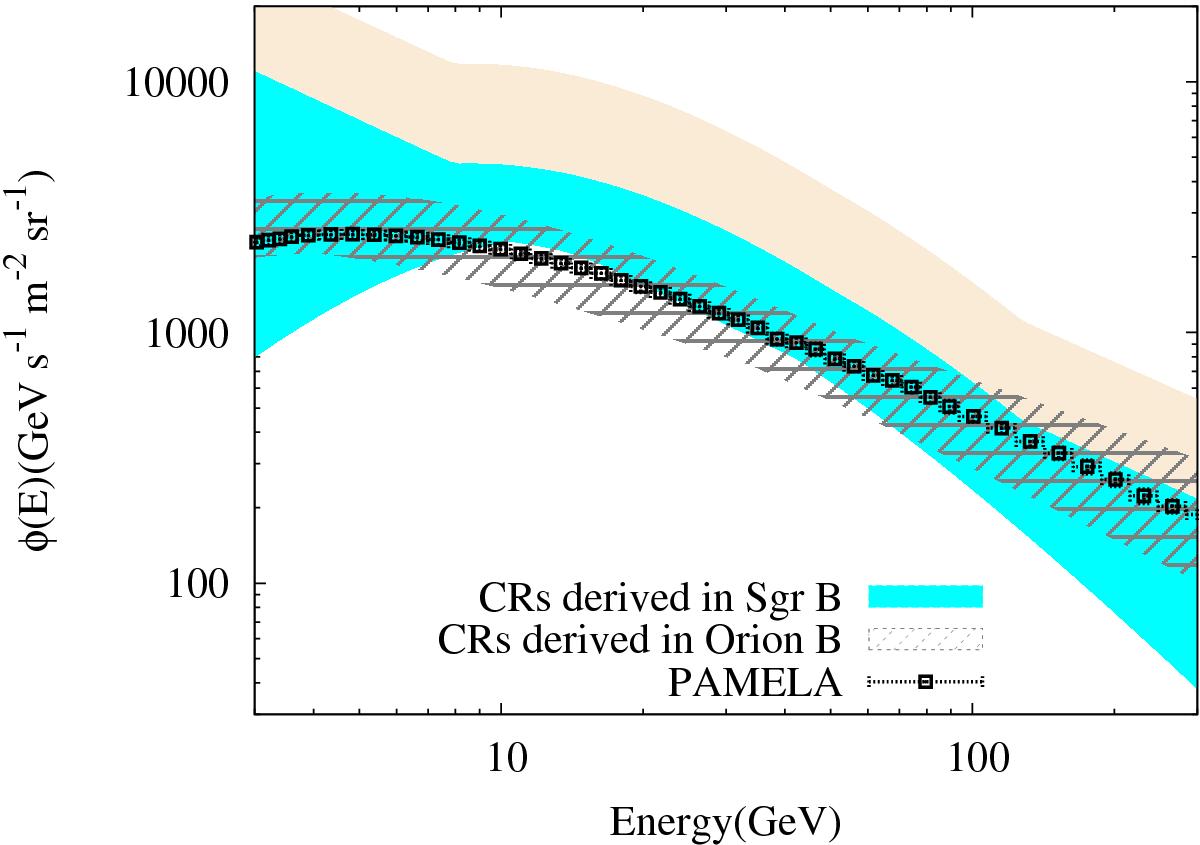
Derived CR proton spectrum of Sgr B region as defined in the text. The shaded regions are derived by assuming the mass of the Sgr B region is either 1.5 × 10⁷M⊙ (aqua) or between 0.6−1.5 × 10⁷M⊙ (“old lace” white). The crosses display the CR spectrum derived assuming a local CR spectrum, as per the PAMELA observations, whilst the grey hatched region represents the CR proton spectrum derived for the Orion B region derived in Yang et al. (2014).
Current usage metrics show cumulative count of Article Views (full-text article views including HTML views, PDF and ePub downloads, according to the available data) and Abstracts Views on Vision4Press platform.
Data correspond to usage on the plateform after 2015. The current usage metrics is available 48-96 hours after online publication and is updated daily on week days.
Initial download of the metrics may take a while.