Fig. 3
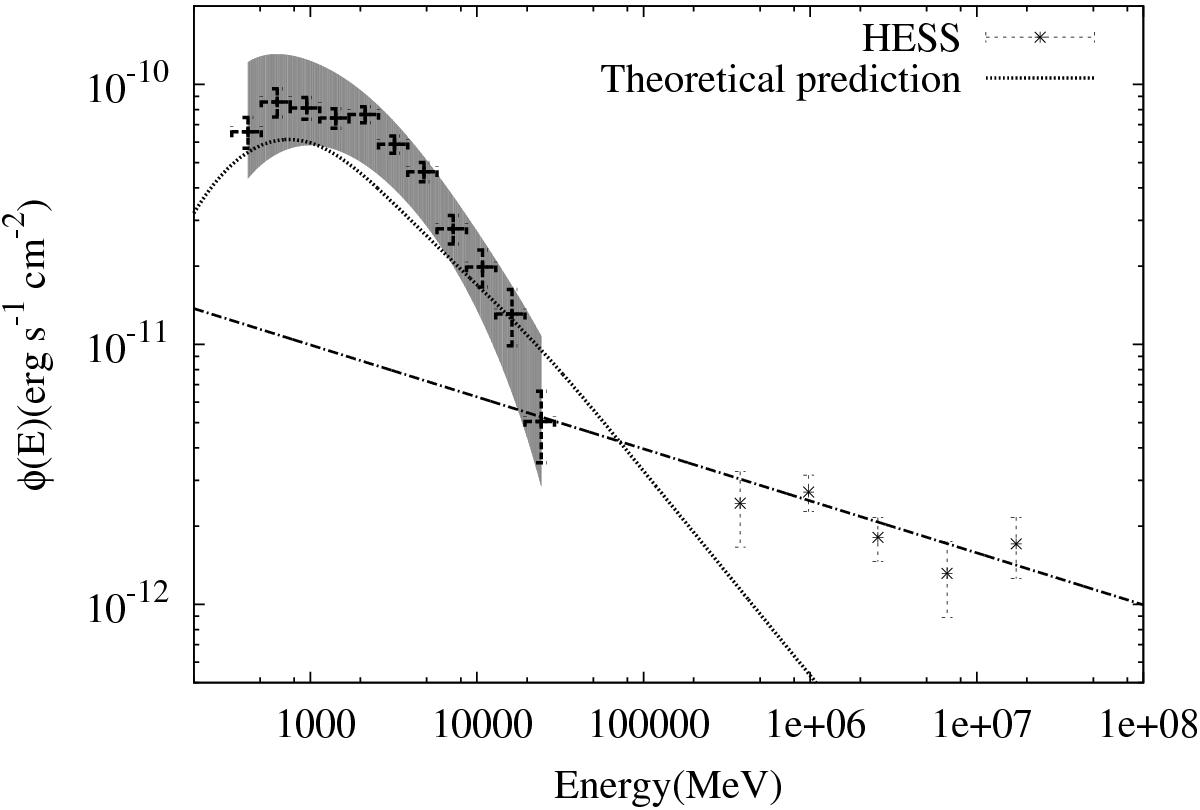
Spectral energy distribution of γ-ray from the Sgr B complex. The grey bands represent the error of the Fermi-LAT measurement and consist of both systematic and statistic errors. The stars (with associated errors) represent the diffuse γ-ray flux discovered by HESS (Aharonian et al. 2006), and the dot-dashed line is the power law obtained using the photon index and normalisation obtained from the original HESS paper reporting its discovery. The dotted line represents the predicted γ-ray spectrum obtained by assuming that the CR spectrum in the Sgr B region is the same as the local CR spectrum measured by PAMELA.
Current usage metrics show cumulative count of Article Views (full-text article views including HTML views, PDF and ePub downloads, according to the available data) and Abstracts Views on Vision4Press platform.
Data correspond to usage on the plateform after 2015. The current usage metrics is available 48-96 hours after online publication and is updated daily on week days.
Initial download of the metrics may take a while.