Fig. 1
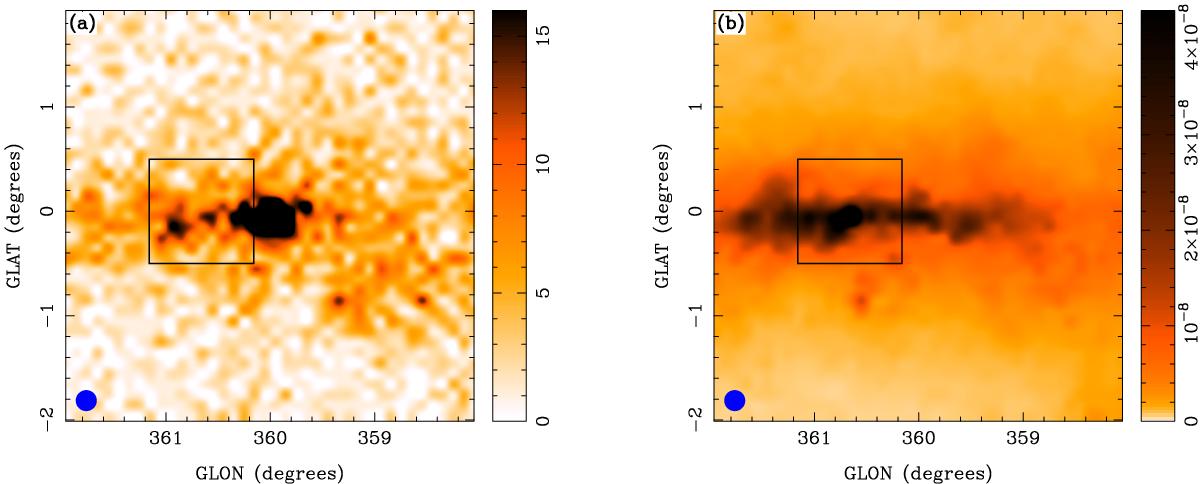
Views of the GC region centred on the Sgr B region (represented by the black box) and smoothed to a common resolution of 0.2° with the beam shown in the lower left-hand corner. a) Fermi-LAT count map obtained by admitting only γ-rays above 6 GeV, using a linear transfer function and the intensity runs from 0 to 15 counts/bin. b) Planck dust opacity map obtained from the Planck collaboration (Planck Collaboration XIX 2011). This image has had a logarithmic transfer function applied to it to enhance the diffuse emission, and its scale runs from 0 to 4.5 × 10⁻⁸.
Current usage metrics show cumulative count of Article Views (full-text article views including HTML views, PDF and ePub downloads, according to the available data) and Abstracts Views on Vision4Press platform.
Data correspond to usage on the plateform after 2015. The current usage metrics is available 48-96 hours after online publication and is updated daily on week days.
Initial download of the metrics may take a while.