Fig. 9
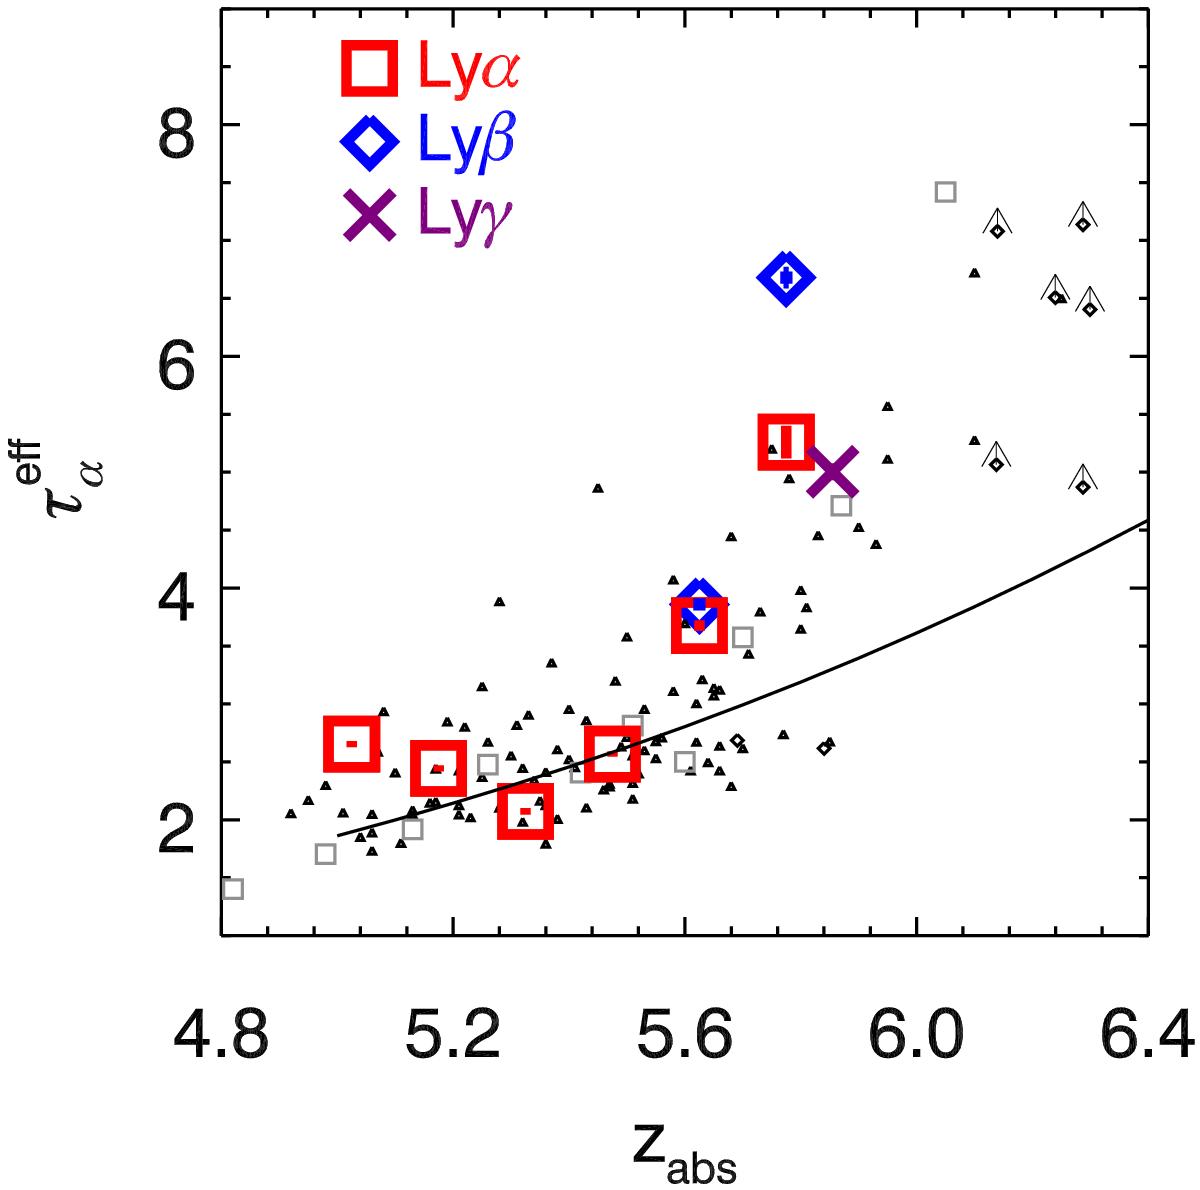
Effective Gunn-Peterson Lyα optical depth of the IGM from the spectrum of GRB 130606A. The large squares, diamonds, and crosses are measurements with error estimates from Lyα, Lyβ, and Lyγ, respectively, the latter two converted to the Lyα optical depth. The small black triangles, diamonds, and the grey squares are measurements based on QSO spectra from Fan et al. (2006), Goto et al. (2011), and Songaila (2004), respectively. The uncertainties of the QSO points are typically a factor of two. The solid line is the best power-law fit to the data at z< 5.5 by Fan et al. (2006, their Eq. (5)).
Current usage metrics show cumulative count of Article Views (full-text article views including HTML views, PDF and ePub downloads, according to the available data) and Abstracts Views on Vision4Press platform.
Data correspond to usage on the plateform after 2015. The current usage metrics is available 48-96 hours after online publication and is updated daily on week days.
Initial download of the metrics may take a while.