Fig. 2
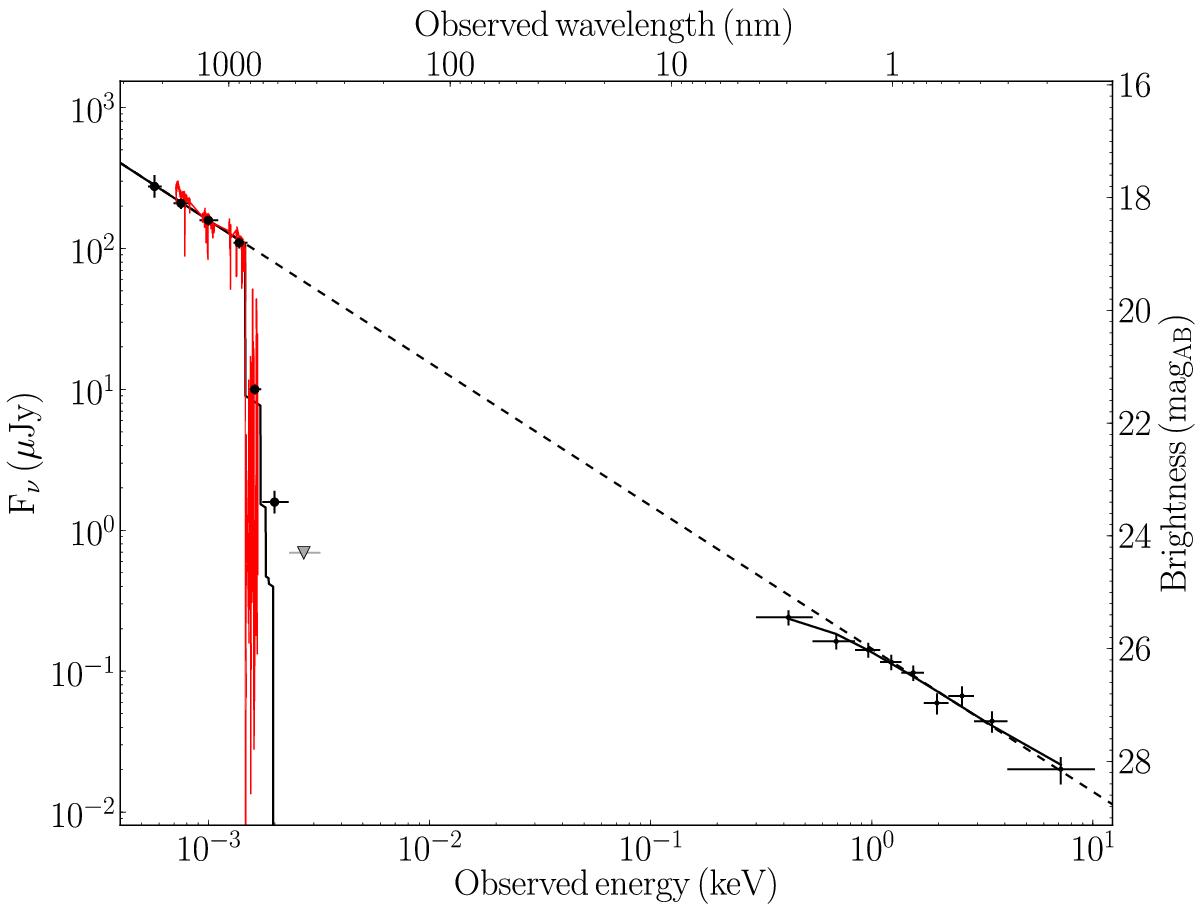
Afterglow spectral energy distribution. The red spectrum is the X-Shooter spectrum, the filled circles on the left are the GROND photometric points (Afonso et al. 2013), and the data points on the right are the (binned) Swift/XRT points. The solid line is the synchrotron spectrum with interstellar absorption, while the dashed line shows the unabsorbed synchrotron spectrum with best fit β = 1.02.
Current usage metrics show cumulative count of Article Views (full-text article views including HTML views, PDF and ePub downloads, according to the available data) and Abstracts Views on Vision4Press platform.
Data correspond to usage on the plateform after 2015. The current usage metrics is available 48-96 hours after online publication and is updated daily on week days.
Initial download of the metrics may take a while.