Fig. A.1
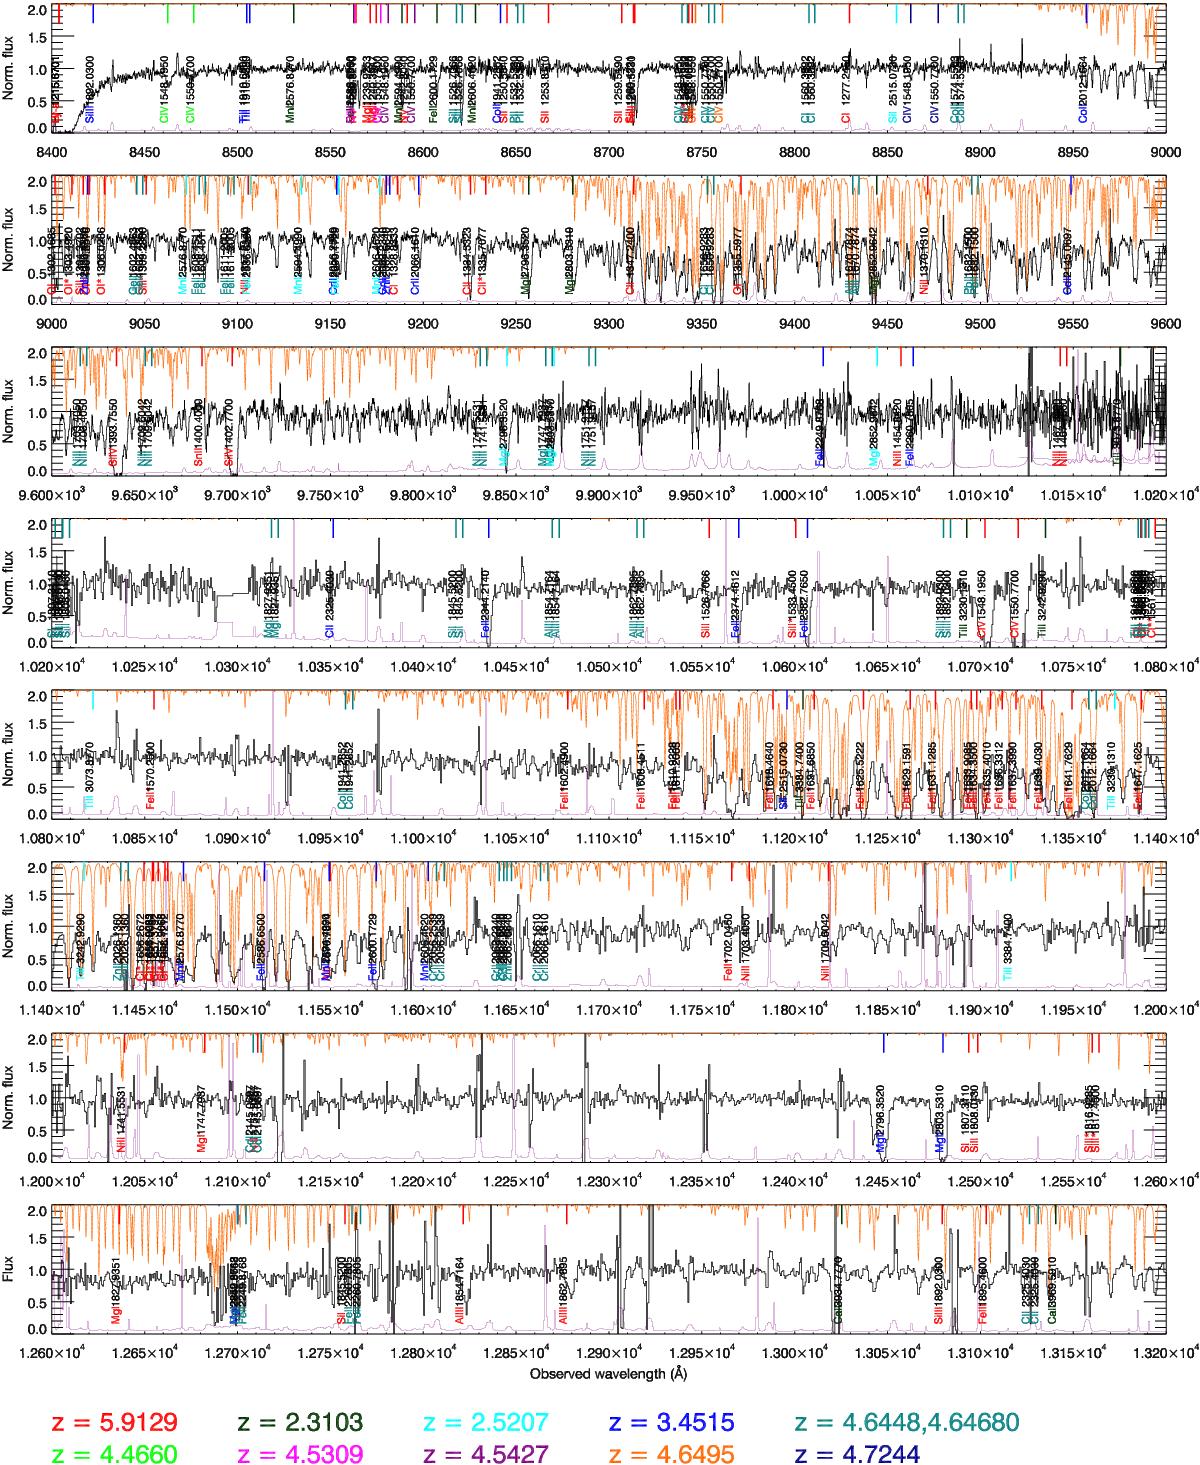
Afterglow spectrum op GRB 130606A, starting from Lyα. The absorption lines are indicated with the ion that produces them and the rest wavelength. We use different colours for the various absorbers (see Sect. 3.5), as indicated in the legend; z = 5.9127 in red is the signature of the host galaxy. The error spectrum is shown in purple, the orange spectrum is the scaled atmospheric transmission spectrum. The spectrum continues in Fig. A.1.
Current usage metrics show cumulative count of Article Views (full-text article views including HTML views, PDF and ePub downloads, according to the available data) and Abstracts Views on Vision4Press platform.
Data correspond to usage on the plateform after 2015. The current usage metrics is available 48-96 hours after online publication and is updated daily on week days.
Initial download of the metrics may take a while.