Free Access
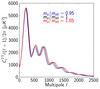
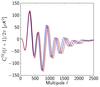
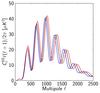
Fig. 2
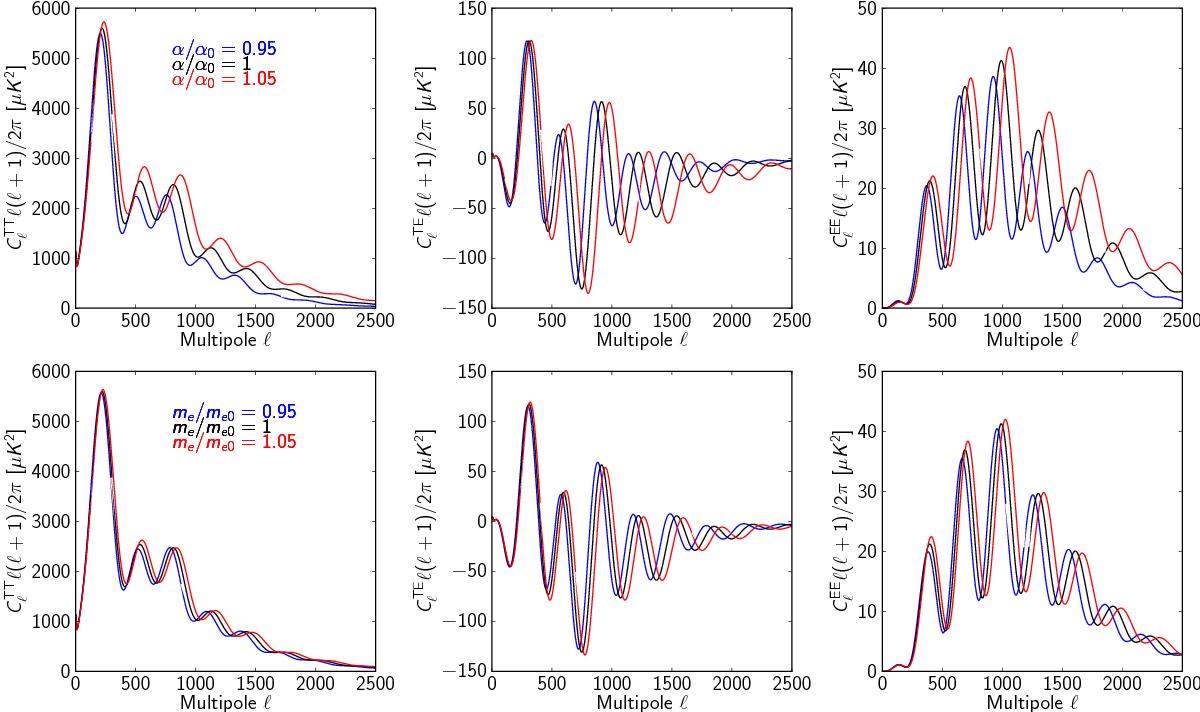
CMB TT, TE and EE angular power spectra for different values of α (upper plots) and me (lower plots). The lines refer to variations of −5% (blue) and + 5% (red), while the standard case is shown in black.
This figure is made of several images, please see below:
Current usage metrics show cumulative count of Article Views (full-text article views including HTML views, PDF and ePub downloads, according to the available data) and Abstracts Views on Vision4Press platform.
Data correspond to usage on the plateform after 2015. The current usage metrics is available 48-96 hours after online publication and is updated daily on week days.
Initial download of the metrics may take a while.